Introduction
Since this concept is unknown to a lot of non-finance grads, I’ll try my best to cover the topic as quickly as possible, and yet make it explainable.
We all have some dreams about how we’re going to spend our lives. And most of these dreams may require us to be financially sufficient, if not rich. And when I say that, I am sure everyone thinks about either starting-up something or investing. Here we’re going to focus on the later. Everyone knows the importance and benefits of investment, and types of financing options available for any investment. Sadly, while many have mentally accepted they’d want to invest when they start earning, a very few know how to!
Modern Portfolio Theory, henceforth referred to as MPT, is the starting point to understand the world of investments, mathematically.
Harry Markowitz suggested the MPT in 1952 for which he won the Nobel Prize in Economic Sciences later.
Understanding the parameters of MPT
MPT is an entirely risk-return based assessment of your Portfolio. This means all it looks for is how to maximize your returns for a given amount of risk. It assumes that different people have a different risk-taking attitude. A young person would be willing to take a greater risk if it might generate him greater returns. While someone who is old, would not be willing to take higher risks and would remain satisfied with lower returns. Whatever the risk attitude, it tries to search for the ‘combination’ of assets in the Portfolio that would generate the highest possible returns (for some risk).
I hope we are clear with the very basic idea of what MPT is. Now let’s briefly understand how MPT defines risk and return for its assessment.
According to MPT, returns are simply the profit you make on an asset over a period of time. It would be negative in case of a loss. Obviously, this is very much intuitive.
Mathematically, R is the percentage change in the value of assets.
R = [(V – Vo)/(Vo)]X100
Risk, according to Markowitz, can be expressed using the standard deviation of returns over a period of time. Recall from your high school statistics, the standard deviation is the measure of how deviated the values are from their mean. So, the logic here is, if the returns more largely deviate from their mean values, the asset having those returns is more volatile. More volatility naturally means its riskier. Look how I emphasized on ‘according to Markowitz’. This is because, there are several methods of risk assessment (eg. VaR, CVaR, Conditional Risk, etc). This is because different people have different notions of what risk means to them. For some, it is how large their return could be on the negative side. For some, by what probability they can suffer an X% of loss on a standard normal distribution of their returns (essentially, the Z-Score). Anyway, to understand MPT, we need the basic definition of risk as described by Markowitz.
Mathematically, Risk (σ) = std(returns over that period)
Now, this is how we can calculate the risk and return of an asset. But obviously, we are not going to invest in a single asset. So more important value to us is the risk and return of your entire Portfolio. Consider a portfolio with N number of assets.
The expected return Ro on each one of these N Assets is the average of per period return R calculated using the percentage change formula discussed before.
R0(single asset) = mean(R of the asset)
Now that we have net expected Return for each of N assets, the net returns of the Portfolio as a combination of all the assets is simply the weighted average. Its obvious, isn’t it? Return is a linear quantity.
So if W1, W2, W3,..Wn are the weights of investment done in each of the Assets, the Portfolio Return (π) is,
π = mean(W.R) ∀ N assets.
Pretty easy right? Now, what would be the risk of entire Portfolio. Weighted average of the individual asset risks? NO!
Remember, risk isn’t a linear quantity plus, the net risk of entire Portfolio will also depend on how one asset moves relative to the rest in the Portfolio. Example, it is generally observed that when markets plummet, gold prices soar (because gold is universal in its value, and people trust it more than cash). Hence if the equities in your Portfolio go down, the gold will rise. We can see a co-dependence of assets with each other, which will also influence the risk of the entire Portfolio.
Hence mathematically,
σ(portfolio) = ΣΣ(Wi.Wj.σi.σj.ρij) ∀ i,j in N
where, ρ(i,j) = correlation between ith and jth asset.
The quantity σi.σj.ρij is also called Co-variance, σ(i,j). Now that we’ve understood the parameters of MPT, let’s get into a very easy and beautiful way to analyse portfolios – graphs.
The Risk-Return Space
The best way to understand and portfolios is to plot the risk and return of each portfolio for a variety of weights W1….Wn, and choose the perfect one for your needs. That ‘perfect’ Portfolio would be the one providing the highest return for a given amount of risk. For a 2-Asset portfolio, the risk-return space looks something like this –
Look how different correlation values between the assets changes the portfolio curve. This curve is plotted by changing the weights assigned to each Portfolio, W1, W2. where W<1 and W1+W2=1
As the weights are changed, the portfolio return and risk change and hence the curve. One beautiful observation which is the heart of Modern Portfolio Theory, is that as the correlation approaches closer to negative values, the return one can get for a particular amount of risk increases. This is because less the correlation more differently, the assets will move respect to each other and as it turns negative, they essentially would move opposite to each other just like the gold-equity example discussed before.
So far, so good. What happens to the curve when there are more than 2 assets. Now there wouldn’t be a single curve connecting 3 assets as in 2 asset case. This is because for every point on the curve between Asset A and B and Asset B and C, there would be an another portfolio X and Y. Hence the risk-return plot in any case of N>2 will actually be a space and not a simple curve.
The Efficient Frontier
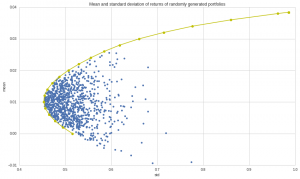
This is an algorithmically generated Portfolio Space for 4 Assets and 1000 different portfolios constructed by altering W1, W2, W3, W4 such that each is less than 1 and sum is 1.
Look at the above space plot carefully. Keeping in mind that one would always be looking to invest in portfolios with a higher return for certain risk. We get a series of portfolios which would be ideal for us if the above condition is considered that is more return for a particular risk. That will be achieved if we invest on any point on a unique curve such that the curve represents the highest possible return for some risk. This curve will be the yellow curve plotted with space. Hence as long as you’re on the upper part of yellow curve, you’re an efficient investor. This curve, as described by the MPT, is termed as the “Efficient Frontier”. The efficient frontier development mathematically is a quadratic convex optimization problem here solved using python’s SciPy library with its convex optimizer. We will, in later blogs, discuss how we can use python to generate this efficient curve along with the portfolio space.
Conclusion
We come to the most beautiful conclusion in the world of Finance. There are a unique set of portfolios which offer you more return for risk as compared to other possible portfolios. Now go back and imagine you being an independent investor having X amount of money wanting to invest in N Assets. Instead of randomly listening to news, people or read articles, you now have trusted mathematical way to construct a perfect portfolio to plan for your dreams.
Hmm. But if this were so easy, everyone would have learnt MPT and made money. But that’s not the case. Probably there are some caveats to it too. This and a lot more in the following blog. Until then keep following CEV Blogs!


