
Introduction
What if I told you sometimes statistical inferences show exactly opposite than what is the reality!? Sometimes the fractions lie to us. Sometimes there are hidden parameters out there which hide in plain sight and cause us to wrongly interpret studies. Simpson’s Paradox is one of them.
The cause is so simple yet non-intuitive that even great researchers make mistakes. There have been legal issues due to wrong interpretations of data, leading to degrade in reputations. All due to one – Simpson’s Paradox!
Not only that, almost all public health research work on the philosophy of which one is better : Which “drug” is better?, Which “medical policy” is better?, etc. In short, almost every final decision is taken by comparing numbers and fractions. What if the answers are the wrong side of paradox? We choose the wrong drug, the wrong policy, the wrong solution!
I present you the first article of a 3 – article series on Simpson’s Paradox.
Simpson’s Paradox : When Statistics lie (1 / 3)
History
UC Berkeley Gender Bias :

One of the best-known examples of Simpson’s paradox is a study of gender bias among graduate school admissions to the University of California, Berkeley. The admission figures for the fall of 1973 showed that men applying were more likely than women to be admitted, and the difference was so large that it was unlikely to be due to chance.

But when examining the individual departments, it appeared that six out of 85 departments were significantly biased against men, whereas only four were significantly biased against women. In fact, the pooled and corrected data showed a “small but statistically significant bias in favor of women.” The data from the six largest departments are listed below, the top two departments by number of applicants for each gender italicized.
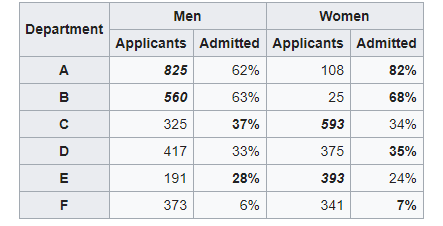
[DataTables taken from Wikipedia]
So what just happened here? When the data was looked after segmentation it revealed a clearly opposite answer! If we look closely in the above table, we can see that women tend to apply at more competitive departments with fewer acceptance rates. Look at departments D, E, and F. Acceptance into these departments was very less. However, women still applied to them. While men tend to apply in departments with greater acceptance rates. Hence net acceptance (when the acceptance into all the departments was clubbed), women acceptance appeared to be far lesser.
Problem solved! However, this particular issue cost UC Berkeley its reputation.
The Drug Paradox :

This is a fictional example which is like a “Hello World” to Simpson’s paradox. Consider two drugs Drug A and B. We need to analyze which drug is better and we do it by comparing how many people were cured by each. The one with better cure rate is, of course, the better drug. Consider the following situation. A total of 200 hundred people were examined for 2 days, a 100 with A and the rest with B. The results of the cure rate was as followed :

Looking at the following data, we can say Drug B was a better performer on both Day 1 and Day 2. Day 1 cure percentage was 80% and for Day 2 it was 50% while the same for Drug A was 70% and 40% respectively. Just by looking at segmented information one might say “Hey buy Drug B, it’s better!” Now look at the net figures for Day 1 and Day 2. Clearly Drug A is better here!! Cure rate for Drug A is 67% while for B it is 53%. Paradox! So what should we say? Which one’s better? There’s a wonderful saying in statistics
Correlation does not imply Causation!
What we did in the first scenario is we looked at the daily basis of results. What we call this in statistics is we checked correlation for Day 1. Yes Drug A performed better on a daily basis however it was just due to a large difference in the number of people surveyed on each day i.e only 10 people were surveyed with Drug B on Day 1 while 90 were for Drug A. A similar case is observed for Day 2. This tends us to make a wrong conclusion.
So which one is better? Drug A of course because in total Drug A’s cure rate is far better than Drug B.
Implications
As I had discussed in the introduction paragraph, there are many painful implications of this paradox. A Data Analyst should hence look carefully before making any analysis. A Data Analyst could be anyone – A physicist, Computer Scientist, Mechanical Engineer testing a pump for its efficiency characteristics, Airport Engineer. That’s the reason everyone should have his / her results tested against the paradox.
My Face off with Simpson’s Paradox:
In my leisure, I generally do a lot of Data Analysis. My first confrontation with Simson’s Paradox was when I was Analysing the Barcelona accidents dataset on Kaggle. If you are particularly interested in the data analysis I performed, you can check it on my GitHub repository. If I hadn’t known about the paradox while working on the dataset, I would have wrongly concluded that nights are safer in terms of serious accidents. Which however was not the case. And so I saved myself from being blinded by this paradox:)
So how should we look after the data? Segmenting it or considering after adding all the values? I wanted to keep the first post without mathematics. In the next post, I would address the paradox with a mathematical rigour! Until then keep reading and enjoy CEV Blogs.
