One of the biggest reasons most people stay away from stock investing and do not take part in this wealth creation journey is mainly because of pre-assumed misconceptions they carry in their minds all the time! So are you the one among those? Then don’t worry! I have your back, and I assure you it won’t be the same after reading this.
Let’s begin breaking the myths in 1 shot.
“Stock Market is gambling.”
Well, yes! It CAN be gambling if you don’t have enough knowledge and skills while you trade or invest and just do it for the sake of doing it so you don’t miss out on your FOMO. So, It’s super important to make sure you invest based on well-researched information and stock analysis, which you can do by gaining the proper knowledge in this field. This is one of the most crucial things to note, as many need help to do this.
“High Risk, High Reward.”
How optimistic this statement sounds right? But let us dig deeper, Definitely, if you have a higher risk appetite, There are chances you may earn a high reward, but the downside is that high risk involves more uncertainty and volatility as in the market. If you firmly believe in the statement above, accepting that it can lead to losses is essential, and “ you “ will have to sustain it.
“Buy Low, sell high.”
To all the newbies in the stock market, you must have heard it, but in reality, if you apply this in markets, there are high chances that you will get into trouble Because if you see the share price falling and seem to buy, you don’t know how much more it is going to fall! And if you sell at high prices, you don’t see how high it will reach. So better, Never catch a falling knife.
“FIIs and HNIs are buying this! I will also buy it. “
One of the big blunders you can make is relying on the data of FIIs(Foreign Institutional Investors) and HNIs(High Net-worth Individuals). Now you might question, what’s wrong with copying the portfolio of successful investors? Well, there is a problem; you know they bought the stock, but do you know at what price? When are they selling it? For what time frame they brought it? And most importantly, Why they bought it? What rationale do they have behind it?
So, Before you start your trading or investing journey, avoid committing these mistakes again, keep a clear mindset while investing, and take charge of investments! Wishing you a happy and successful investing journey ahead,
The COVID-19 pandemic ravaged the whole world and disrupted the entire global supply chain. It prompted companies to invest in other countries around the world to not depend on China wholly. This strategy is called China plus one strategy
How did China manage to attract initial foreign investment?
In the early 1980s, there was a spike in labor and manufacturing costs in western
countries. This made Western companies shift their manufacturing base from their
native countries to China, where cheap labor, low production cost, and enormous
domestic consumer markets for the companies to invest.
Significant reasons why companies are looking for alternatives to
Chinese?
A) The political ideology that China follows.
B) The spike in labor cost.
C) Geopolitical conflicts with neighboring countries.
On the other hand, the consumer market in India is already established and ready with cheap and skilled labor. Promoting employment of the youth will be highly beneficial for the country’s economy and attract foreign companies to the country.
How can India appeal to foreign investors?
Tariffs: Decrease import taxes on raw materials and machinery. The tax levied on raw material imports is about 40.8% and 29.8% after GST on machinery, making foreign companies think about their options upon investing in India.
Infrastructure: make transportation and infrastructure better and invest in special economic zones to attract labor for the factories.
A) The road connectivity in the country poses a significant problem as the quality of roads is below average in some parts of the country, which causes a delay in transportation and increases the cost of maintenance of the vehicle.
B) The airports and seaports are still not capable of handling a large consignment.
C) A faulty logistical approach also poses a problem that leads to companies reconsidering their options.
D) Invest in making good schools and hospitals around these economic zones to ensure the quality education of children of labor.
Address the power problem: Govt has to focus on giving power at a subsidized rate and invest in renewable energy sources to remove dependence on fossil fuels.
A) Invest in modernizing power transmission to long distances. Most of the power lines are still not underground, which poses a problem during natural calamities.
B) The government has to ensure that the power is supplied to each part of the country so that the factories in remote areas can function smoothly.
Try to promote the growth of small-scale industries and establish a communication channel between these small-scale industries and the MNCs and promote collaboration between them.
Promising stores of natural resources.: Ensure a proper supply of water and metals and minerals to these regions.
Try to make the policies & transactions transparent and make the system less corrupt. Also, there should be a reduction in government red tape, and the role of bureaucracy in making industries should be reduced.
Strongly investing and introducing new technologies and communication channels in manufacturing and transportation. The government has to aggressively support and promote skill development to ensure jobs for the country’s youth.
Resolve political ideologies and avoid clashes to ensure peace in the areas and attract the interest of foreign companies.
A) The Center has to cooperate with the state governments to reduce the clash between the center and the state.
B) Ensure stability with proper policing in the area to prevent antisocial elements from wreaking havoc and preventing rioting.
It is not just the health of the masses that the coronavirus pandemic has hit, but almost all the aspects of normal life. Businesses, markets etc., are no different and have received a big blow. Profits plummeted, and most companies were pushed to run in losses making some companies bankrupt too. However, there were some businesses, startups that not only managed to stay afloat but thrived in these times of crisis. Innovation being a key to beat the covid blues. There was a myriad of opportunities for new-age startups and investors to tap into, given the rise in demand for a variety of services . A bull market is a term for the stock market when the securities rise, and a bear market is when securities fall for a sustained period. This blog focuses on those Indian based or originated startups, businesses, newly turned unicorns etc., who developed and flourished in this pandemic, when most of the economy was about to hit rock bottom, thus becoming bulls of the bear Indian market.
Healthcare
Healthcare was an industry that constantly had hopes hooked to it in the pandemic. Doctors, nurses, medical professionals were the need of the hour. From the business point of view, pharmaceutical companies, telemedicine, online medical consultations etc., had profits jumping many folds. The startups that prospered in the healthcare sector were:-
Serum Institute of India:- With net sales of INR 5,446 crores amidst the COVID-18, Serum earned a net profit of INR 2,251 crore. Or a net margin of 41.3%. Serum Institute of India the vaccine manufacturer that has become pivotal to India’s recovery from this pandemic.
Practo:- Practo reported a 500% spike in online medical consultation under lockdown.
PharmEasy:- E-pharmacy is the most important e-commerce sector in this ongoing pandemic. Due to home confinement, people are finding it very inconvenient to get their prescriptions and over the counter (OTC) medicines, so instead, they switched to telemedicine like PharmEasy, Netmeds etc.
Bioline:- Based in Indore, Bioline India was founded by Neeta Goel and her late husband Rajeev Goel in 2001 to manufacture and supply affordable medical equipment to the masses. During COVID-19, the demand skyrocketed for this once slow-moving product.
Zyro care:- Kamayani Naresh, a retired Indian Navy officer, claims to have developed a long and sustainable solution to boost immunity — zyropathy. A Delhi-based company that provides food and herbal supplements.
Education
With schools shut down all across the globe, the education sector underwent quite a revolutionary state. The education system required expeditious reforms to avoid the education of thousands of students coming to a standstill. EdTech startups saw a boom in their market. Online classrooms and courses came to students’ rescue. The businesses that burgeoned in the education sector were.
Unacademy:- Unacademy beat the pandemic to enter the prestigious list of unicorns in India. The EdTech firm raised around Rs 1,125 crore in a funding round led by Softbank Vision Fund 2 and participation from existing investors, including Facebook.
Byju’s:- Byju’s is one of the top e-learning startups of India, which is surpassing all its competitors and has become one of the few decacorns in Indian startup history after crossing $10.5 Billion valuations in the midst of this pandemic.
Gradeazy in Surat:- After their first startup had a false start in 2018, Surat-based Dishant Gandhi and Alok Kumar found a new opportunity to satiate their hunger for entrepreneurship with EdTech when the lockdown started, and all the schools and education moved online. The duo launched Gradeazy in June 2020 to enable educational institutes to conduct online examinations for just Re 1 per exam.
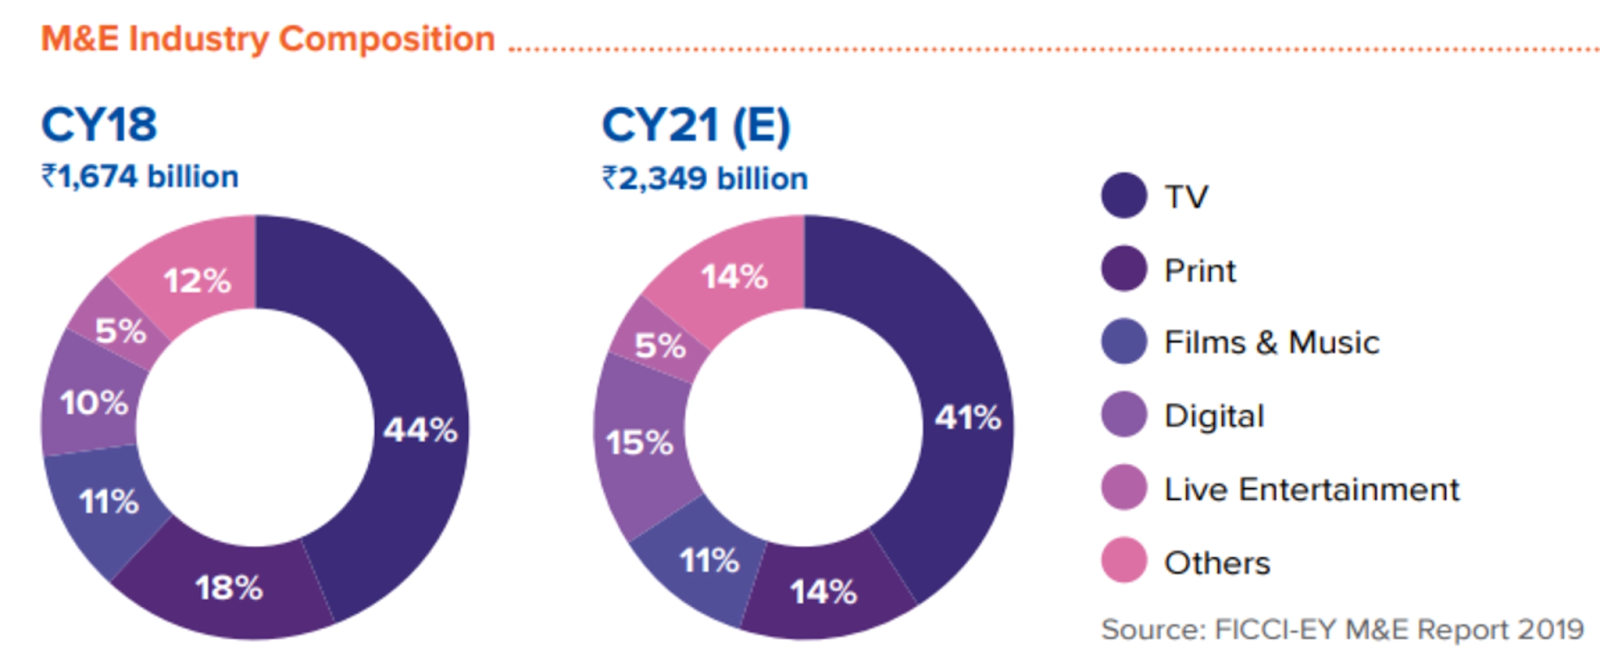
Media and Entertainment
With the freedom to go out and carry our daily routines being curbed, it was evident that people were going to turn to TVs and other platforms to while away the extra time in hand. The media and entertainment industry in India put up a great show in 2020.
Dailyhunt:- News and content aggregator Dailyhunt has become India’s first tech unicorn focused on vernacular content after raising $100 Mn funding from Google, Microsoft and Falcon Edge’s Alpha Wave Incubation at a unicorn valuation.
Khabri:- In one of the newest startups, which was launched in October 2017, Khabri is India’s first and the fastest growing digital audio platform. Khabri provides audio content in regional languages where anyone can create, listen or discover in the app. As a great initiative, Khabri has introduced the COVID-19 helpline for the visually impaired population of India as a massive outreach program.
According to Inc42 Plus, the media and entertainment sector received a total funding of $877.8 Mn across 85 funding deals last year, compared to $561.27 Mn in 2019, led by online video startups like SimSim, Trell and other TikTok alternatives.
NeeStream:- A popular OTT platform in South India. With several new films being released on the platform, NeeStream has been witnessing a rise in subscriber numbers.
Finance and Technology(FinTech)
Razorpay:- Bengaluru-based payments gateway Razorpay entered the unicorn club in October 2020 when it raised $100 Mn in its Series D round, led by GIC and Sequoia Capital India. The funding round also saw participation from the company’s existing investors, such as Ribbit Capital, Tiger Global, Y Combinator and Matrix Partners.
Pine Labs:- Noida-headquartered Pine Labs became the first unicorn for the year 2020, after its corporate round in January, led by New York-based financial services major Mastercard. Founded in 1998 by Lokvir Kapoor, Pine Labs provided its services to over 100K merchants in 3700 cities and towns across India.
Zerodha:- Bengaluru-based Zerodha was founded in 2010 by Nithin and Nikhil Kamath and offers stockbroking services. The company has claimed to have over a million active clients who trade and invest and is now valued at around 7000 crores or 1 billion approx.
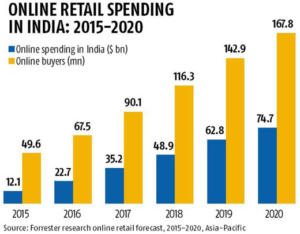
E-commerce
A study showed that Indian e-commerce grew 84% in 4 years owing to the Covid-19 impact. When it was not possible to go out shopping, products were brought to individual doorsteps. A giant boom in local, national and international e-commerce startups is a testimonial to it.
Flipkart:-Flipkart witnessed new user growth of close to 50 per cent soon after the lockdown.
Bigbasket:-Bigbasket has had a huge inflow of orders as more and more consumers are preferring to order essentials and groceries online amid COVID-19. Bigbasket has added around 10,000 new workers to meet the massive influx of orders, which shows the shift to digital platforms in need of the millennium.
Custkartin Bokaro:-Custkart has its own factory near Bokaro that produces merchandise, and all the workers come from the nearby villages.
Miscellaneous
Nykaa:- Mumbai-based omnichannel lifestyle retailer Nykaa entered the unicorn club after raising around $13.6 Mn from its existing backer Steadview Capital. The funds were raised as part of Nykaa’s Series F funding round.
Cars24:- Gurugram-based online used car marketplace Cars24 entered the unicorn club by raising $200 Mn in a Series E funding round led by DST Global.
Rooter:- One of India’s biggest Sports community platforms, Rooter has raised $1.7 million (~ Rs 12.4 crore) in a pre-series A funding round at a time when almost all sporting activities have been seized across the globe. The Esports platform plans to capitalise on its upcoming Esports and gaming content and communities. Rooter engages its fans with user-generated live audio and video content.
Gaming
Paytm First Games registered a 200% increase in user base.
After the ban on the popular Chinese short-video app TikTok under 69A of the IT Act, its alternatives, including Trell, ShareChat, Chingari, Bolo Indya, Mitron, Roposo, Moj and Josh, among others, started gaining massive popularity and traction in the market.
Games like FAU-G, Mask Gun and others emerged as alternatives for many users in India after PUBG Mobile’s ban.
Podcasting
India is witnessing an unprecedented boom in podcasts, and it is a country with 22 modern Indian languages and around 720 recognized dialects. The linguistic diversity in India is increasing the demand for the information available on various platforms in vernacular languages. With a growth rate of 33 per cent, the vernacular internet ecosystem in the country is thriving.
The pandemic has an impact on economies and businesses throughout the world and will keep doing so for even some time in the future. It is no doubt now that opportunities can be squeezed even from the most diabolical of times. The pandemic has proved to be both an edge or stumbling block for establishments and enterprises across the globe. 2020 was a year of crisis, and crisis is where innovation thrives.
We are in the middle of a crisis. Not just the Covid-19, but the psychological turmoil of making money from every single dime available, even if it costs the whole economy’s meltdown. Does the short term or long term recession teach a lesson and put an end to this? It doesn’t seem so.
Something similar happened in mid-2008, whose foundations were laid in America’s housing market and the whole world had to face the consequences.
We’ll go step by step, starting from understanding the housing system and how it all collapsed. Don’t get muddled by the terms used ahead, as the concepts behind those are simple. The wall street people use these terms to keep the common people out of their way.
The Housing System
You must be familiar with the term mortgage. In case you are not, visualize it like this- you want to buy a $100,000 house, but you have only $30,000 with you. You approach a bank and ask for a loan. You pay $30,000 as a down payment, the bank lends you the rest of the money and based on your net worth, income statement, etc. bank decides a term of repayment and a reasonable rate of interest. Let’s assume this rate to be 10%. The bank allows you to pay it off in 30 years as monthly installments.
The house here represents a mortgage. Every month as you pay off the mortgage, you own the house a bit more and the bank owns a bit less. That’s how you own the house entirely after 30 years, and it’s no more a mortgage. And as the housing and real estate market is always soaring, real estate prices will always rise, as assumed before the crisis.
So your wealth will still be increasing even though you have to pay interest on the mortgage to the bank. It’s a win-win situation for all.
Building The Castles Of Money
Banks don’t always keep these mortgage bonds to themselves. They sell it to big investment banks and earn a nice commission. So the interests that you were paying on your loan went to their pockets now. But these small transactions didn’t keep the adrenaline of the big banks and investors running. So they came up with the idea of Securitization Food Chain. The idea was to bundle thousands of these mortgages on home loans along with mortgages on several other loans and sell it all together. This way, the yields will go up, and they assumed the risk to be still low as the housing market was always considered vital. They called it Mortgage-Backed Securities (MBS). The deal sounded like music to the ears of investors. So the investors all over the world leveraged lumps of money and invested heavily in these MBS, packed in a small magical box: a CDO.
A CollateralizedDebt Obligation or a CDO classified the above- mentioned mortgage bonds as per their risk of returns, the risk of trusting people that they will pay their mortgage on time. The ones who have a nice flow of income have a low risk and are rated AAA. Below them are AA, BBB, and the worst are BB-rated. BB refers to the houses owned by highly irresponsible people who hardly deserve to get a loan. These BB-rated mortgages are referred to as Sub-prime Mortgages. All these ratings are given by separate rating agencies that played a significant part in setting the crisis’s blueprint.All these bonds are then further sold to investors at a nice profit. The whole system was great because almost everyone earned a good profit and kept their cashflow running until things took an ugly turn.
The Inflation Of Real Estate Bubble
As the investors were earning good returns and demanded more MBS to invest in, but they couldn’t find any because most of the ‘eligible’ families already had a mortgage. So the banks started giving out homes to less responsible families, with zero down payment, no income certificate, nothing but just a formality of paperwork, and a promise of payback. They didn’t think of it as an issue because even if the families don’t pay, investors will own the house, which is also a great asset until there are so many houses for sale in the market.
In that situation, the ratings of those risky mortgage bonds would have gone down, right? But that didn’t happen. There was no one to ask the rating agencies how they were giving out the ratings. They were an authority in themselves whose ultimate aim was to impress their clients and earn money. The investment banks paid these rating agencies to rate their bonds and these agencies had no liability if their ratings proved wrong. They claimed the CDOs made by them had 90%+ AAA-rated bonds, but under the hood, it consisted of highly irresponsible homeowners who didn’t even deserve to get a $100 loan. So all these pieces of worthless junk bonds were bundled and sold as if they were gold, and no one bothered to look what’s inside. Investment banks were making profits by selling CDOs and agencies were getting paid for giving AAA ratings. Real estate prices skyrocketed as it was so easy to own one. A boom like this is called a Market Bubble– where everyone is so flattered with something in the market that they believe its demand will never go down and its value keeps on rising, even much more than its actual self-worth. But these prices are not more than an illusion created by fraudulent systems. These bubbles eventually burst and make a hard impact on everyone’s life. This time it was the Real Estate bubble in America that burst aloud in 2008.
Getting Insurance To The Crisis
The highly unregulated derivatives market of the USA allowed the bankers to gamble on anything. They could bet on the rise and fall of oil prices, bankruptcy of a company, or even the weather. Some of the psychopaths saw that the fall of the real estate was coming. So they introduced the Credit Default Swaps which were like insurance to the mortgage bonds. The buyer of these swaps will pay monthly premiums to the seller and the latter will pay colossal money to the former if the underlying mortgage bond defaults or fails. The demand for these swaps kept growing as more and more people realized that the housing market would crash. These swaps were packed in Synthetic CDOs.
So who was buying these swaps? The ones who were selling the underlying bonds. The investment banks were selling AAA-rated bonds in the markets and on the other hand, purchasing swaps on BB and BBB-rated bonds, as they knew the bonds would eventually fail.
Some highly corrupt officials even represented banks in the morning and the rating agencies in the evening. They packed the extremely risky bonds in the morning for the availability of bonds in the market and rated them 90% AAA in the evening for the investors’ sake. They also introduced a new complex derivative- a CDO of a CDO, called CDO Squared. The sole purpose behind their existence was to introduce more financial instruments in the markets, so there is always something to bet on. Let us see how they turned the whole world into a giant casino-
Suppose A and B are playing a game
C and D take a $100 bet on whom among A and B will win
E and F take a $1000 bet on whom among C and D will win
G and H bet on E and F
…. …. …. ….
There existed CDOs and synthetic CDOs as a bet against CDOs. Eventually, a $50 million investment had more than a billion dollars betting against it. The market for insuring bonds grew 20 times larger than the actual mortgage. The major players in this whole circus were investment banks like Goldmann Sachs, Morgan Stanley, Bear Stearns and Lehman Brothers, financial conglomerates like JP Morgan and Citigroup, securities insurance companies AIG, rating agencies like Moody’s, Standard & Poor’s, and many more. But from where was all this money coming? And how did they get the gigantic guts to borrow and invest? It was all possible because of the highly unregulated markets and the availability of cheap credit. Probably they all knew about the dangers they were playing with, but they also knew one more thing- they had grown so large that the government would have to save them if they go bankrupt, otherwise the economy would collapse. And that’s exactly what happened. The American taxpayer had to pay for all of their gamblings in the form of emergency guarantees and bailouts by the Federal Reserve. Several papers were published, a lot of people doubted about the crash, but nobody did anything tangible, not even the Federal Reserve.
You can now see how a system of billions and billions of dollars depended on a lie. Everyone was playing with a time bomb. This real estate bubble was about to burst and the whole world was about to hear it loud.
The Burst of The Bubble
When markets hit a little low in late 2007, people started to default on their mortgage and started leaving the houses. The number of these faulty people skyrocketed. The supply of houses in the market became much higher than demand, resulting in the breakdown of the prices. Now there was no sense in paying a $100,000 mortgage for the house worth only $90,000, even for those who were able to pay it.
Even well-off families started leaving their homes after taking their share, leaving the banking investors, small investors and lenders with a bunch of worthless properties. There was no more selling and buying of real estate in the market now as everyone knew it was useless. As every sector of the economy is deeply interconnected, the whole economy froze.
Companies like Lehman Brothers started filing for bankruptcy. Bear Stearns went out of cash. The stock market was on a bear run. The people had not seen the stock market steep so low in decades. People were thrown out of their offices in the peak hours of the day as their companies were no longer able to pay them. The so-called stock market experts were roaming on streets with their box of office essentials, which was now worthless.
The vast floors of Morgan Stanley and Goldmann Sachs, which used to trade billions of dollars a day, were now empty. The United States was no longer able to trade with other countries and the whole globe went into a recession that was never seen or expected in decades.
Five trillion dollars from the economy disappeared.
Eight million lost their jobs.
Six million lost homes.
And that was just in The USA.
Conclusion
In the post-crisis world, the government and the Fed should have taken responsibility for all the chaos and sent the gold plated corrupt bankers to jail. But nothing like this remotely happened. Instead, the so-called intellectuals blamed the small business people, laborers and employees as they always do.
The Fed and treasury department of The USA are still governed by the ones who were the crisis architects. The system never improved and the same things went on, only a bit modified to show everyone that they have changed.
Many major businesses in the globalized world are still void and it’s a bitter truth because that’s how the modern economies work. We may never know how many bubbles the global economy is having and how many of them have burst by the Covid-19 Crisis. We need to be aware of the lies in the market to keep our mind and soul together in times of these crises.
It was my 16th birthday. I took a tepid bath, wore my new black shirt with a cream white pant, put on my party wear shoes and was ready for hosting a party in a nearby restaurant. Me, having fun with my friends on the dining table was about to have a slice of Garlic Bread when my eyes took a glance of the television running on the far side near the counter. It was unusual as the television was not tuned to any music or sports channel as it happens most of the times in restaurants. Rather the screen flashed Breaking News into my eyes. The news quoted some of the words spoken by the Prime Minister of a country with a population of 1.3 billion. The news read:
I didn’t get those words at that point of time and rather chose to concentrate on my Garlic Bread. But soon with the passage of time, we all realized its true meaning and purpose and the extent to which it has impacted our lives. In this blog, I am going to brief you about the biggest demonetization in the history of the world.
Process of Demonetisation:
The plan to demonetise the 500 and 1000 rupee notes initiated 6 to 10 months before the report by SBI analysed possible strategies and effects of demonetisation. RBI started preparing for new banknotes in May 2016 whose printing started in October.
A Union Cabinet meeting took place on 8 November 2016 where everyone was informed about the plan by Narendra Modi. Soon after the meeting, Modi announced demonetisation in an unscheduled live national televised address.
It was announced that the demonetised banknotes could be deposited in a bank over a period of next 50 days until 30 December 2016. A certain limit was kept by RBI for exchanging old demonetised notes with new legal tender notes. The limit was kept at Rs. 4,000 per person till 13 November, which was increased to Rs. 4,500 till 17 November and reduced to 2,000 till 25 November.
Until 2 December 2016, fuel pumps, government hospitals, railways and airline booking counters, state government recognised dairies and ration stores, and crematoriums were allowed to accept demonetised banknotes. Cash withdrawals from bank accounts were also restricted and a daily limit on withdrawals from ATMs was imposed.
Purpose of Demonetisation
The government claimed that the move will curtail the shadow economy and reduce the use of illicit and counterfeit cash to fund illegal activity and terrorism. The move aimed at converting India from a non-tax-compliant society to a tax-compliant society. It was also aimed at serving the purpose of reducing the number of high denomination notes and boosting the digital payment sector in India. There was also a need to reduce the flow of counterfeit banknotes in the economy.
Why eliminating black money is important?
Curbing black money is necessary as it causes a regressive distribution of income in the society which leads to widening of the gap between the rich and the poor. Black money also leads to the under-estimation of the true size of the economy and therefore distortion of production pattern.
Black money is a parallel economy which operates side by side the real economy. This dual economic pattern causes inflation to increase by certain basis points which the government can’t account for as they have no legal data of that spending.
Outcome of Demonetisation
It was estimated by the government that they will be able to permanently remove 20% of the demonetised banknotes from the circulation but this didn’t happen. According to a report by RBI in 2018, 99.3% of the demonetised banknotes returned to the banking system.
Initially, after the demonetisation, there had been a decrease in counterfeit 500 and 1000 rupee banknotes but in 2017-2018, the number of counterfeit 500 and 2000 rupee banknotes increased than the previous year. Therefore, the number of counterfeit banknotes detected experienced no significant change due to demonetisation.
After demonetisation, India witnessed growth in tax collection of 14.6% in FY17 and 17.1% in FY18 as compared to 8.9% and 6.9% in FY15 and FY16 respectively. But seen from a historical perspective, a 14% or even 17% annual increase in direct taxes isn’t extraordinary for the Indian economy.
Conclusion:
Overall we all know that demonetisation has been a big failure for the Indian economy. Some economists severely criticised the move while some said the method of implementation was inappropriate. Whatever it was, people had to suffer to a great extent.
Government from time to time has implemented flawed policies which have caused a strong economic disturbance in the past 4 years. Their policies have lacked proper planning and implementation into the system. Implementation of GST was another example of mismanagement on the part of the government. The economy is now bleeding with a 23.9% YOY decline in GDP for Q1 of FY21. Is it a result of one more misguided policy in the form of Atmanirbhar Bharat Abhiyaan?
Reading Time: 2minutesThe corona pandemic has claimed many lives across the world. It’s other side effects include the widespread rampage on all sectors of economy of the world. It has caused the closure of many small industries, businesses and enterprises and it continues to haunt the future of not only SMEs(Small and Medium Enterprises), MSMEs (Micro Small Medium Enterprises), Microfinance Institutions but also big companies.
In view of this, big Chinese banks, Private Equities and other multilateral instruments are investing heavily in such falling companies. These Chinese corporations work under the beneficial owner; the government of China. China’s recent increase in investment in HDFC bank has exceeded 1% which has poked the bear (RBI) into looking into this matter.
ATTRACTING INVESTORS IS GOOD, SO WHATS THE PROBLEM?
The problem is that by investing heavily they are buying shares of these companies at “THROWAWAY PRICES”. The impact of this, is that they will be majority stakeholders of these companies or aim to attempt buying them eventually (“HOSTILE TAKEOVER”). This will give them power to control these businesses and help them direct profit money to China.
China currently invests around $4 billion in Indian startups.18 out of 30 Indian unicorns (startups having more than $1 billion market capitalization) have Chinese funding.Big investors from China -Alibaba, Tencent , ByteDance have made huge investments in Paytm, Byju’s , OYO, Ola, Big Basket, Swiggy, Zomato. China dominates Indian markets in pharmaceutical APIs(Active Pharmaceutical Ingredients), mobile phone markets, automobiles and electronic and project imports.
HOW IS THE DRAGON’S MARKET INVASION BEING STOPPED?
The Government of India and RBI (Reserve Bank of India) lost no time in rectifying it’s policies.The government has decided to screen Foreign Direct Investments (FDI) from countries sharing a land border with India or where the beneficial owner of an investment into India is situated in or is a citizen of any such country. The capital market regulator of India ,SEBI (Securities Exchange Board of India) is also digging deeper into Foreign Portfolio Investors(FPI) composition from China, by seeking beneficiary details from jurisdictions like Mongolia, Bhutan, Nepal, Bangladesh , Afghanistan and Yemen.
SO WHAT’S NEXT?
These policy changes have put an end to such hostile takeovers yet other measures need to be taken in order to mitigate China’s sway over the market.
Since this concept is unknown to a lot of non-finance grads, I’ll try my best to cover the topic as quickly as possible, and yet make it explainable. We all have some dreams about how we’re going to spend our lives. And most of these dreams may require us to be financially sufficient, if not rich. And when I say that, I am sure everyone thinks about either starting-up something or investing. Here we’re going to focus on the later. Everyone knows the importance and benefits of investment, and types of financing options available for any investment. Sadly, while many have mentally accepted they’d want to invest when they start earning, a very few know how to! Modern Portfolio Theory, henceforth referred to as MPT, is the starting point to understand the world of investments, mathematically. Harry Markowitz suggested the MPT in 1952 for which he won the Nobel Prize in Economic Sciences later.
Understanding the parameters of MPT
MPT is an entirely risk-return based assessment of your Portfolio. This means all it looks for is how to maximize your returns for a given amount of risk. It assumes that different people have a different risk-taking attitude. A young person would be willing to take a greater risk if it might generate him greater returns. While someone who is old, would not be willing to take higher risks and would remain satisfied with lower returns. Whatever the risk attitude, it tries to search for the ‘combination’ of assets in the Portfolio that would generate the highest possible returns (for some risk). I hope we are clear with the very basic idea of what MPT is. Now let’s briefly understand how MPT defines risk and return for its assessment. According to MPT, returns are simply the profit you make on an asset over a period of time. It would be negative in case of a loss. Obviously, this is very much intuitive.
Mathematically, R is the percentage change in the value of assets.
R = [(V – Vo)/(Vo)]X100
Risk, according to Markowitz, can be expressed using the standard deviation of returns over a period of time. Recall from your high school statistics, the standard deviation is the measure of how deviated the values are from their mean. So, the logic here is, if the returns more largely deviate from their mean values, the asset having those returns is more volatile. More volatility naturally means its riskier. Look how I emphasized on ‘according to Markowitz’. This is because, there are several methods of risk assessment (eg. VaR, CVaR, Conditional Risk, etc). This is because different people have different notions of what risk means to them. For some, it is how large their return could be on the negative side. For some, by what probability they can suffer an X% of loss on a standard normal distribution of their returns (essentially, the Z-Score). Anyway, to understand MPT, we need the basic definition of risk as described by Markowitz.
Mathematically, Risk (σ) = std(returns over that period)
Now, this is how we can calculate the risk and return of an asset. But obviously, we are not going to invest in a single asset. So more important value to us is the risk and return of your entire Portfolio. Consider a portfolio with N number of assets.
The expected return Ro on each one of these N Assets is the average of per period return R calculated using the percentage change formula discussed before.
R0(single asset) = mean(R of the asset)
Now that we have net expected Return for each of N assets, the net returns of the Portfolio as a combination of all the assets is simply the weighted average. Its obvious, isn’t it? Return is a linear quantity. So if W1, W2, W3,..Wn are the weights of investment done in each of the Assets, the Portfolio Return (π) is,
π = mean(W.R) ∀ N assets.
Pretty easy right? Now, what would be the risk of entire Portfolio. Weighted average of the individual asset risks? NO! Remember, risk isn’t a linear quantity plus, the net risk of entire Portfolio will also depend on how one asset moves relative to the rest in the Portfolio. Example, it is generally observed that when markets plummet, gold prices soar (because gold is universal in its value, and people trust it more than cash). Hence if the equities in your Portfolio go down, the gold will rise. We can see a co-dependence of assets with each other, which will also influence the risk of the entire Portfolio. Hence mathematically,
σ(portfolio) = ΣΣ(Wi.Wj.σi.σj.ρij) ∀ i,j in N
where, ρ(i,j) = correlation between ith and jth asset.
The quantity σi.σj.ρij is also called Co-variance, σ(i,j). Now that we’ve understood the parameters of MPT, let’s get into a very easy and beautiful way to analyse portfolios – graphs.
The Risk-Return Space
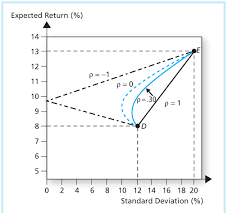
The best way to understand and portfolios is to plot the risk and return of each portfolio for a variety of weights W1….Wn, and choose the perfect one for your needs. That ‘perfect’ Portfolio would be the one providing the highest return for a given amount of risk. For a 2-Asset portfolio, the risk-return space looks something like this –
Look how different correlation values between the assets changes the portfolio curve. This curve is plotted by changing the weights assigned to each Portfolio, W1, W2. where W<1 and W1+W2=1 As the weights are changed, the portfolio return and risk change and hence the curve. One beautiful observation which is the heart of Modern Portfolio Theory, is that as the correlation approaches closer to negative values, the return one can get for a particular amount of risk increases. This is because less the correlation more differently, the assets will move respect to each other and as it turns negative, they essentially would move opposite to each other just like the gold-equity example discussed before. So far, so good. What happens to the curve when there are more than 2 assets. Now there wouldn’t be a single curve connecting 3 assets as in 2 asset case. This is because for every point on the curve between Asset A and B and Asset B and C, there would be an another portfolio X and Y. Hence the risk-return plot in any case of N>2 will actually be a space and not a simple curve.
The Efficient Frontier
This is an algorithmically generated Portfolio Space for 4 Assets and 1000 different portfolios constructed by altering W1, W2, W3, W4 such that each is less than 1 and sum is 1.
Look at the above space plot carefully. Keeping in mind that one would always be looking to invest in portfolios with a higher return for certain risk. We get a series of portfolios which would be ideal for us if the above condition is considered that is more return for a particular risk. That will be achieved if we invest on any point on a unique curve such that the curve represents the highest possible return for some risk. This curve will be the yellow curve plotted with space. Hence as long as you’re on the upper part of yellow curve, you’re an efficient investor. This curve, as described by the MPT, is termed as the “Efficient Frontier”. The efficient frontier development mathematically is a quadratic convex optimization problem here solved using python’s SciPy library with its convex optimizer. We will, in later blogs, discuss how we can use python to generate this efficient curve along with the portfolio space.
Conclusion
We come to the most beautiful conclusion in the world of Finance. There are a unique set of portfolios which offer you more return for risk as compared to other possible portfolios. Now go back and imagine you being an independent investor having X amount of money wanting to invest in N Assets. Instead of randomly listening to news, people or read articles, you now have trusted mathematical way to construct a perfect portfolio to plan for your dreams.
Hmm. But if this were so easy, everyone would have learnt MPT and made money. But that’s not the case. Probably there are some caveats to it too. This and a lot more in the following blog. Until then keep following CEV Blogs!
Reading Time: 9minutesWhat is GDP? By definition GDP (Gross Domestic Product) is the market value of all finished good and services produced within a country in a year.
Explanation: A finished good is a good which will not be sold as part of some other good. For ex-eggs
Case 1: If a bakery buys eggs it is not considered in GDP as it’s not a finished good as it will be used for making cake and price of cake will be considered in GDP.
Case 2: If same eggs are bought by a consumer to make an omelet then egg will is considered as a finished good as it won’t be sold again as a part of some other good.
Again going through the definition GDP, it is the value of goods produced that year. What does this mean? This means that the good needs to manufactured or produced the same year. For example, if a house was produced 2 years ago and is sold in the current year it does not count in the current years GDP as it was not produced the current year. Only the sale of new houses adds to GDP.
GDP only counts for goods and services produced within a country, this means that if you buy a mobile phone imported from united states that adds to united states’ GDP, not India’s, on the other hand, a cloth manufactured in India and exported to France adds to India’s GDP.
Market value- if a good is not sold in a market it is typically not counted in GDP. For ex- biscuits sold in a country have a fix market price so they count to the country’s GDP as it can be counted because of having a fix market price per packet of biscuit. But on the other hand, if a dog or any other animal is sold it doesn’t count in the country’s GDP as it is not having a fixed market price.
A country’s GDP may increase in 2 ways-
#1 Only the GDP number goes up but the economy is not producing more goods and services, how is possible? Well, in this case, it can be inflation which is the driving force of the higher GDP, this increase looks good on paper but its just a mirage.
#2 Actual increase, in this case, the country is actually producing more number of valuable goods and services.
Now there are multiple ways to measure the GDP of a country. We will look at 3 of them, #1 GDP in nominal terms; #2 GDP in real terms; and #3 GDP in PPP terms (purchasing power parity).
#1 Nominal GDP
The following equation is used to calculate the GDP:
GDP = C + I + G + (X – M)
or
GDP = private consumption + gross investment + government investment + government spending + (exports – imports).
This does not take into account the inflation rate.
As shown in the graph, the Indian economy has grown from 58 billion us dollars in 1965 to 2110 billion dollars in 2015 ie. it has increased 35.5 times in these 50 years but its a nominal increase.
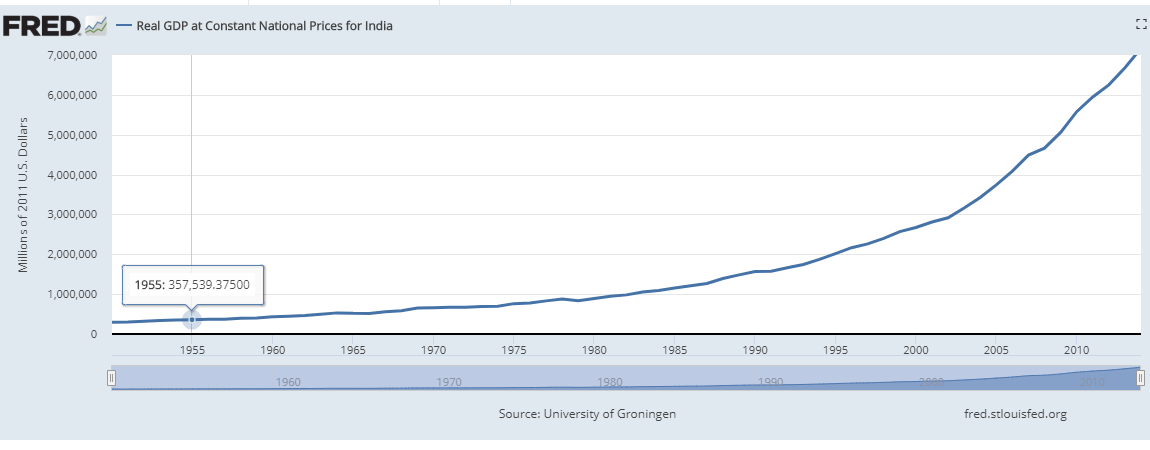
#2 GDP in real terms – it takes into account inflation.it adds up all goods and services produced in an economy over the same set of prices over the years. It shows that if the prices of goods and services hadn’t changed over the time then what would be the GDP.
Here it shows that India’s economy was at 520 billion us dollars in 1965 and 7600 billion us dollars in 2015 that means that the real growth of the Indian economy was 14.6 times during these 50 years.
#3 GDP in PPP terms: GDP PPP is gross domestic product converted to international dollars using purchasing power parity rates. Purchasing power parity (PPP) is a neoclassical economic theory that states that the exchange rate between two countries is equal to the ratio of the currencies’ respective purchasing power. for example, if a burger cost 2 dollars in the US and the same burger cost 40 rupees in India the PPP ratio is 20. This is the reason why GDP in PPP terms in the case of poorer countries is much higher than the nominal GDP as goods are available at cheaper rates as it takes into account the exchange rates of countries. A fall in either currency’s purchasing power would lead to a proportional decrease in that currency’s valuation on the foreign exchange market.
India’s GDP in nominal terms in 2017 was 2.6 trillion dollars whereas in terms of PPP terms it was 9.46 trillion dollars.
Current nominal GDP rankings are (US billion $):
#1 United States 19,390,600 #2 China 12,014,610 #3 Japan 04,872,135 #4 Germany 03,684,816 #5United Kingdom 02,624,529 #6 India 02,611,012 #7 France 02,583,560 #8 Brazil 02,054,969 #9 Italy 01,937,894 #10Canada 01,652,412
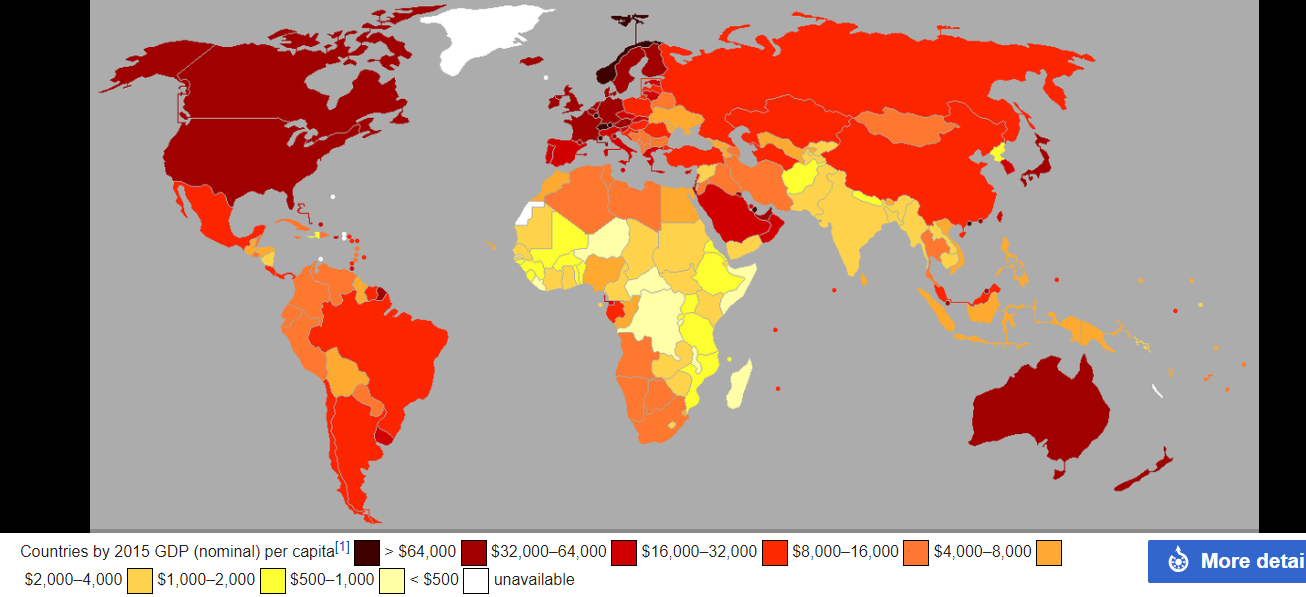
Current nominal GDP per capita rankings are (US $):
#1 Luxembourg 105,863 #2 Switzerland 80,637
#3 Norway 75,389 #4 Iceland 70,248 #5 Ireland 68,710 #6 Qatar 61,024 #7 United States 59,792 #8 Singapore 57,713 #9 Denmark 56,630 #10 Australia 55,692
Current GDP PPP rankings are (US billion $):
#1China 23,159,134 #2 United States 19,390,600 #3 India 09,459,002 #4 Japan 05,428,813 #5 Germany 04,170,790 #6 Russia 04,007,831 #7 Indonesia 03,242,771 #8 Brazil 03,240,319 #9 United Kingdom02,914,042 #10 France 02,835,746
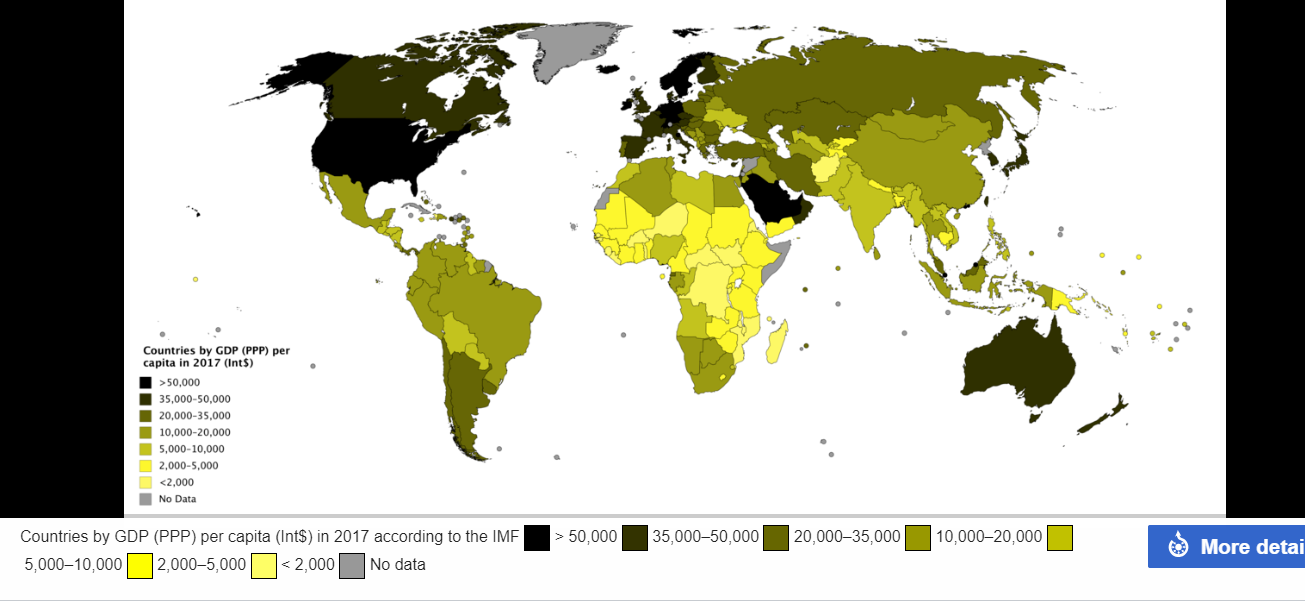
Current GDP PPP per capita rankings are (in US $):
Here the major difference to notice is that poorer countries have low nominal GDP but higher GDP PPP this is because of exchange rates.
Predictions for GDP by 2050:
#1 World GDP:
Current world GDP in nominal terms is 78.28 trillion US $ and is predicted to increase by 130% to 180 trillion US $.
#2 World’s top 10 economies by 2050:
China is expected to be at the 1st position in 2050. while India will overtake GDP of United States by 2045 and will eventually overtake China by the year 2080. While the US’s economy will not be able to grow as fast as that of India’s and China’s its share in the world economy will begin to shrink.
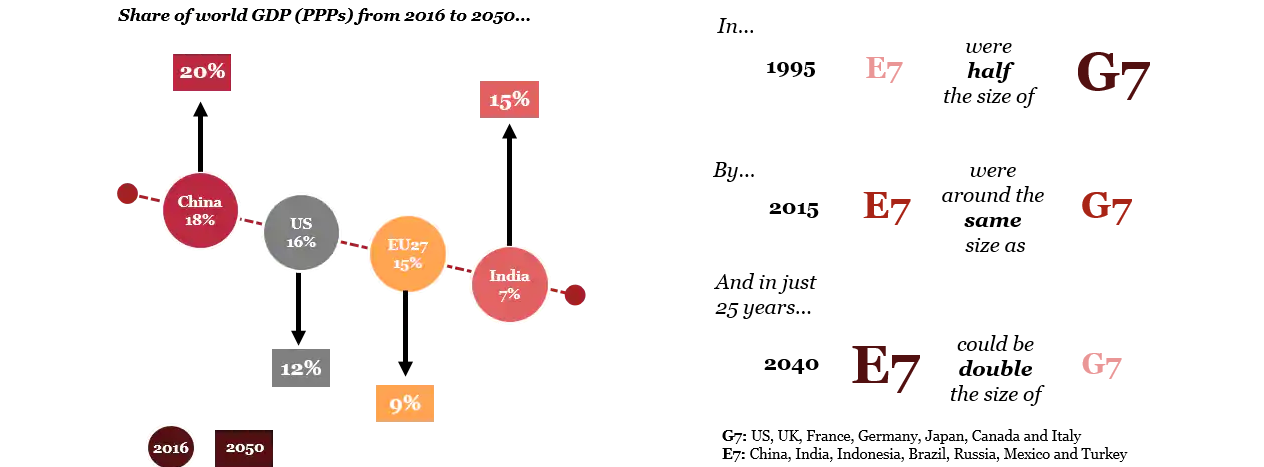
#3 World economic share (GDP PPP terms):
#4 United States economy:
The US is currently the world’s largest economy will a GDP of over 19.4 trillion US$.
US economy is predicted to grow at an annual average rate of 1.4% by 2050.
Current GDP of the US is at 19.4 trillion US$ and is predicted to be at 34.1 trillion US$ by 2050 (nominal GDP).
#5 Economy of China:
The Chinese economy is predicted to grow at an annual average rate of 4 to 5% by 2050 which will make it the world’s largest economy by 2032 (by overtaking the United States) and remain at 1st spot till 2060 at least with a GDP of 58.1 billion $.
China is currently the world’s largest economy in PPP terms having an 18% share of the world economy.
#6 The Indian economy:
Currently, India is ranked 6th with a 2.6 trillion $ economy in terms of nominal GDP and 3rd with a 9.46 trillion $ economy in terms of GDP PPP.
India is growing fast at an average rate of 6.5 % to 7 % in the past 10 years, in fact, it is the fastest growing major economy in the world along with China and is expected to grow at this rate of many years to come.
It is expected that India will maintain a steady growth rate of around 5.5% for the next 5 to 6 decades and will overtake the economy of United States by 2045 and will eventually overtake China by 2070 to become world’s largest economy.
India is expected to have a 44 trillion $ economy by 2050 and an 86 trillion $ economy by 2080.
What’s the difficulty India is facing and why is India not growing faster?
The major problem for India is its huge population, India is projected to have a population of 1.66 billion in 2050 which means that though it will become the largest economy, still the people of India will not be as rich as say an American or a Chinese.
For ex- say the population of the US in 2050 is 340 million and its economy is 34 trillion $ then its per capita income will be 100,000 $ whereas in the case of India the population will be 1.66 billion and the GDP will be at about 44 trillion $ which means that India’s GDP is much higher than that of US but still due to its population, the per capita income in India in 2050 will be 26,000 $ which means though having a huge economy, people of India will be 4 times poorer than the people the US and will be at par of the world economy.
And secondly, India is nowhere close to its fullest potential for growth.
India has an excellent geography, a very huge amount of people in the working age group and its current economy not very huge at 2.6 trillion $, considering these factors India’s growth predicted by some of the great economists is 20%. But the factors which are stopping India from growing are lack of infrastructure, its education system, fluctuating electricity supply, political issues and many more. But still, after considering all these factors India is doing very well and is on the right track and hopefully, it will become the world’s largest economy very soon.
Conclusion:
The world economy could more than double in size by 2050, far outstripping population growth, due to continued technology-driven productivity.
Six of the seven largest economies in the world are projected to be emerging economies in 2050 led by China (1st), India (2nd) and Indonesia (4th), the US could be down to third place in the global GDP rankings while the EU(European Union) share of world GDP could fall below 10% by 2050.
But emerging economies need to enhance their institutions and their infrastructure significantly if they are to realize their long-term growth potential.
India needs to realize it’s potential and work on it accordingly and if India does so then who knows India will be the world leader of the economy very soon.