What is GDP? By definition GDP (Gross Domestic Product) is the market value of all finished good and services produced within a country in a year.
Explanation: A finished good is a good which will not be sold as part of some other good. For ex-eggs
Case 1: If a bakery buys eggs it is not considered in GDP as it’s not a finished good as it will be used for making cake and price of cake will be considered in GDP.
Case 2: If same eggs are bought by a consumer to make an omelet then egg will is considered as a finished good as it won’t be sold again as a part of some other good.
Again going through the definition GDP, it is the value of goods produced that year. What does this mean? This means that the good needs to manufactured or produced the same year. For example, if a house was produced 2 years ago and is sold in the current year it does not count in the current years GDP as it was not produced the current year. Only the sale of new houses adds to GDP.
GDP only counts for goods and services produced within a country, this means that if you buy a mobile phone imported from united states that adds to united states’ GDP, not India’s, on the other hand, a cloth manufactured in India and exported to France adds to India’s GDP.
Market value- if a good is not sold in a market it is typically not counted in GDP. For ex- biscuits sold in a country have a fix market price so they count to the country’s GDP as it can be counted because of having a fix market price per packet of biscuit. But on the other hand, if a dog or any other animal is sold it doesn’t count in the country’s GDP as it is not having a fixed market price.
A country’s GDP may increase in 2 ways-
#1 Only the GDP number goes up but the economy is not producing more goods and services, how is possible? Well, in this case, it can be inflation which is the driving force of the higher GDP, this increase looks good on paper but its just a mirage.
#2 Actual increase, in this case, the country is actually producing more number of valuable goods and services.
Now there are multiple ways to measure the GDP of a country. We will look at 3 of them, #1 GDP in nominal terms; #2 GDP in real terms; and #3 GDP in PPP terms (purchasing power parity).
#1 Nominal GDP
The following equation is used to calculate the GDP:
GDP = C + I + G + (X – M)
or
GDP = private consumption + gross investment + government investment + government spending + (exports – imports).
This does not take into account the inflation rate.
As shown in the graph, the Indian economy has grown from 58 billion us dollars in 1965 to 2110 billion dollars in 2015 ie. it has increased 35.5 times in these 50 years but its a nominal increase.
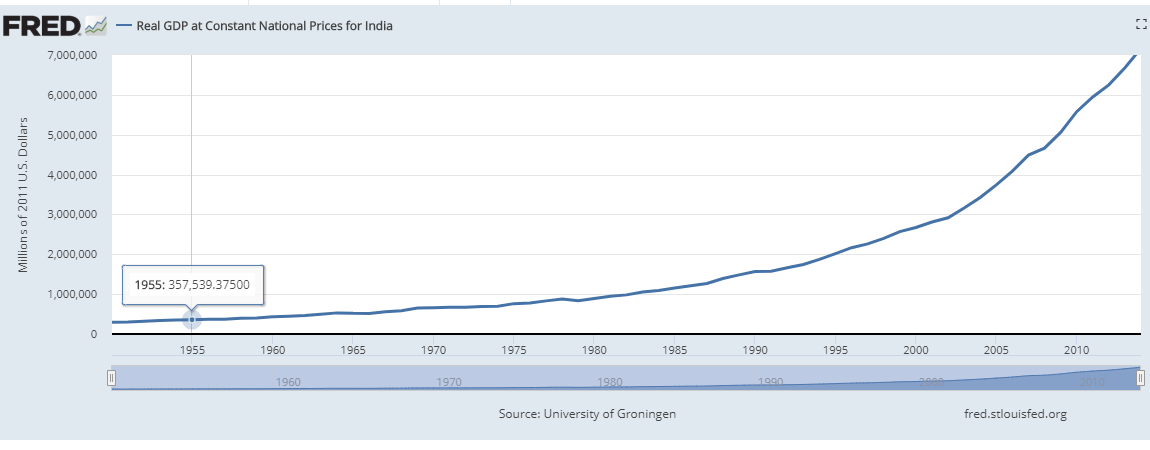
#2 GDP in real terms – it takes into account inflation.it adds up all goods and services produced in an economy over the same set of prices over the years. It shows that if the prices of goods and services hadn’t changed over the time then what would be the GDP.
Here it shows that India’s economy was at 520 billion us dollars in 1965 and 7600 billion us dollars in 2015 that means that the real growth of the Indian economy was 14.6 times during these 50 years.
#3 GDP in PPP terms: GDP PPP is gross domestic product converted to international dollars using purchasing power parity rates. Purchasing power parity (PPP) is a neoclassical economic theory that states that the exchange rate between two countries is equal to the ratio of the currencies’ respective purchasing power. for example, if a burger cost 2 dollars in the US and the same burger cost 40 rupees in India the PPP ratio is 20. This is the reason why GDP in PPP terms in the case of poorer countries is much higher than the nominal GDP as goods are available at cheaper rates as it takes into account the exchange rates of countries. A fall in either currency’s purchasing power would lead to a proportional decrease in that currency’s valuation on the foreign exchange market.
India’s GDP in nominal terms in 2017 was 2.6 trillion dollars whereas in terms of PPP terms it was 9.46 trillion dollars.
Current nominal GDP rankings are (US billion $):
#1 United States 19,390,600
#2 China 12,014,610
#3 Japan 04,872,135
#4 Germany 03,684,816
#5United Kingdom 02,624,529
#6 India 02,611,012
#7 France 02,583,560
#8 Brazil 02,054,969
#9 Italy 01,937,894
#10Canada 01,652,412
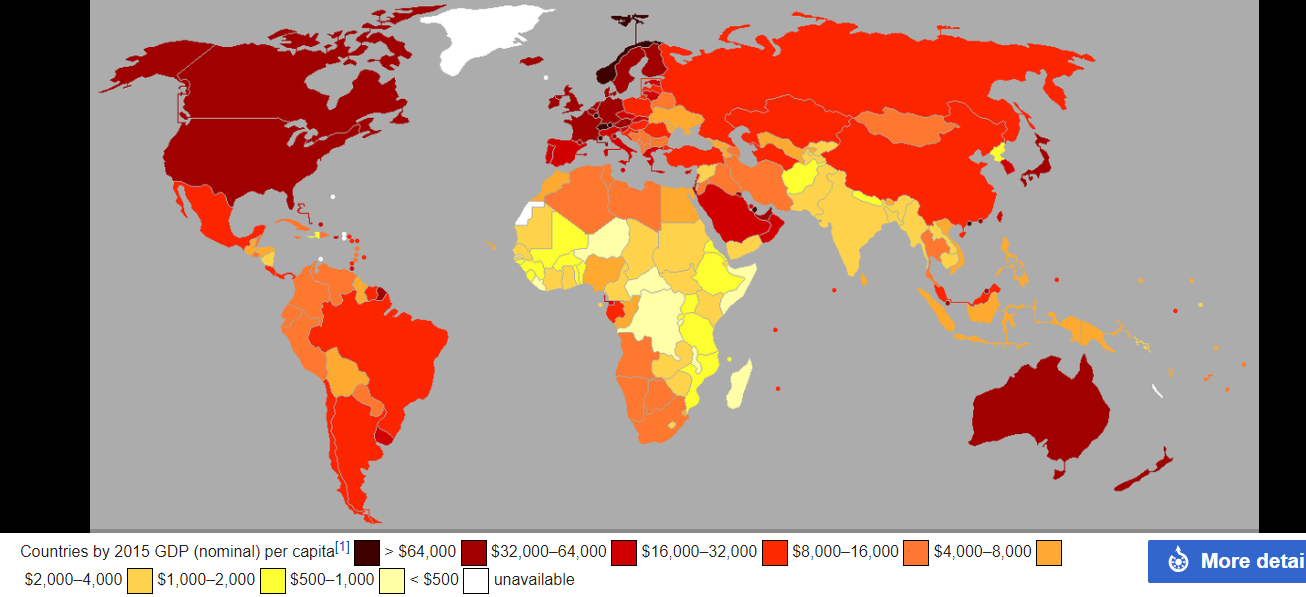
Current nominal GDP per capita rankings are (US $):
#1 Luxembourg 105,863
#2 Switzerland 80,637
#3 Norway 75,389
#4 Iceland 70,248
#5 Ireland 68,710
#6 Qatar 61,024
#7 United States 59,792
#8 Singapore 57,713
#9 Denmark 56,630
#10 Australia 55,692
Current GDP PPP rankings are (US billion $):
#1China 23,159,134
#2 United States 19,390,600
#3 India 09,459,002
#4 Japan 05,428,813
#5 Germany 04,170,790
#6 Russia 04,007,831
#7 Indonesia 03,242,771
#8 Brazil 03,240,319
#9 United Kingdom 02,914,042
#10 France 02,835,746
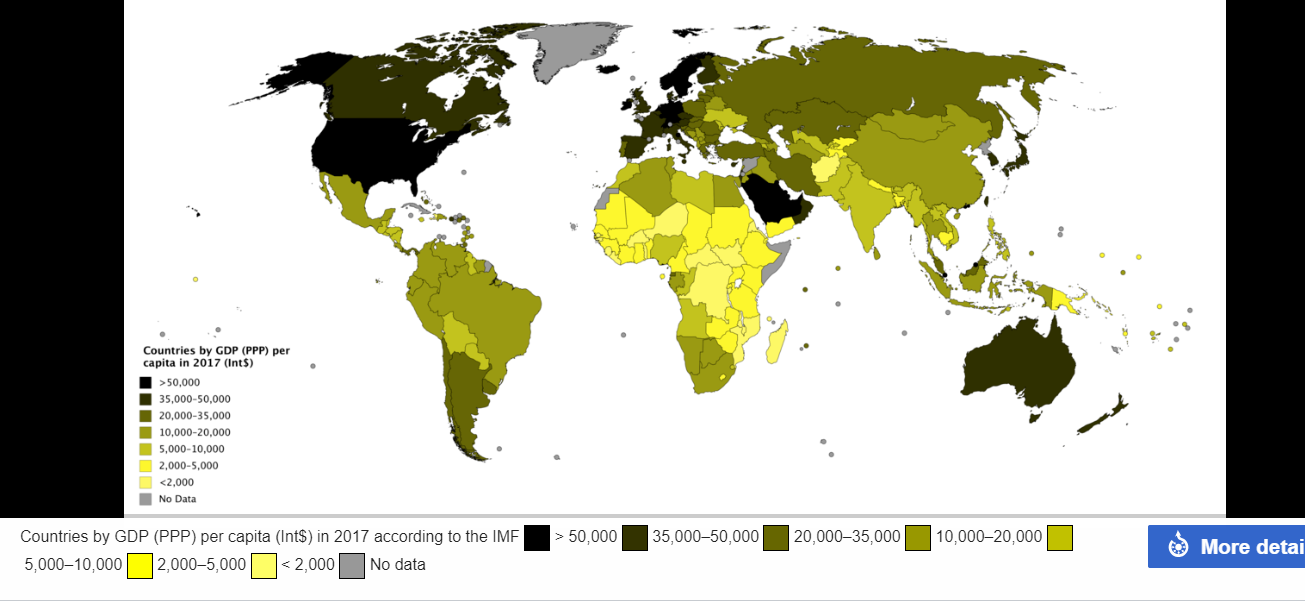
Current GDP PPP per capita rankings are (in US $):
#1 Qatar 124,927
#2 Luxembourg 109,192
#3 Singapore 90,531
#4 Brunei 76,743
#5 Ireland 72,632
#6 Norway 70,590
#7 Kuwait 69,669
#8 United Arab Emirates 68,245
#9 Switzerland 61,360
#10 San Marino 60,359
Here the major difference to notice is that poorer countries have low nominal GDP but higher GDP PPP this is because of exchange rates.
Predictions for GDP by 2050:
#1 World GDP:
Current world GDP in nominal terms is 78.28 trillion US $ and is predicted to increase by 130% to 180 trillion US $.
#2 World’s top 10 economies by 2050:
China is expected to be at the 1st position in 2050. while India will overtake GDP of United States by 2045 and will eventually overtake China by the year 2080. While the US’s economy will not be able to grow as fast as that of India’s and China’s its share in the world economy will begin to shrink.
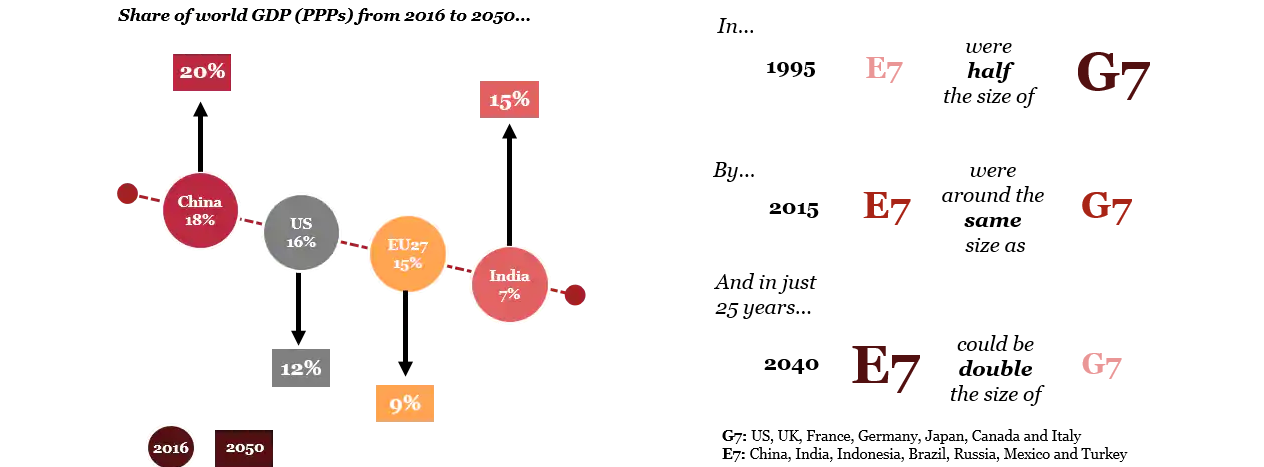
#3 World economic share (GDP PPP terms):
#4 United States economy:
The US is currently the world’s largest economy will a GDP of over 19.4 trillion US$.
US economy is predicted to grow at an annual average rate of 1.4% by 2050.
Current GDP of the US is at 19.4 trillion US$ and is predicted to be at 34.1 trillion US$ by 2050 (nominal GDP).
#5 Economy of China:
The Chinese economy is predicted to grow at an annual average rate of 4 to 5% by 2050 which will make it the world’s largest economy by 2032 (by overtaking the United States) and remain at 1st spot till 2060 at least with a GDP of 58.1 billion $.
China is currently the world’s largest economy in PPP terms having an 18% share of the world economy.
#6 The Indian economy:
Currently, India is ranked 6th with a 2.6 trillion $ economy in terms of nominal GDP and 3rd with a 9.46 trillion $ economy in terms of GDP PPP.
India is growing fast at an average rate of 6.5 % to 7 % in the past 10 years, in fact, it is the fastest growing major economy in the world along with China and is expected to grow at this rate of many years to come.
It is expected that India will maintain a steady growth rate of around 5.5% for the next 5 to 6 decades and will overtake the economy of United States by 2045 and will eventually overtake China by 2070 to become world’s largest economy.
India is expected to have a 44 trillion $ economy by 2050 and an 86 trillion $ economy by 2080.
What’s the difficulty India is facing and why is India not growing faster?
The major problem for India is its huge population, India is projected to have a population of 1.66 billion in 2050 which means that though it will become the largest economy, still the people of India will not be as rich as say an American or a Chinese.
For ex- say the population of the US in 2050 is 340 million and its economy is 34 trillion $ then its per capita income will be 100,000 $ whereas in the case of India the population will be 1.66 billion and the GDP will be at about 44 trillion $ which means that India’s GDP is much higher than that of US but still due to its population, the per capita income in India in 2050 will be 26,000 $ which means though having a huge economy, people of India will be 4 times poorer than the people the US and will be at par of the world economy.
And secondly, India is nowhere close to its fullest potential for growth.
India has an excellent geography, a very huge amount of people in the working age group and its current economy not very huge at 2.6 trillion $, considering these factors India’s growth predicted by some of the great economists is 20%. But the factors which are stopping India from growing are lack of infrastructure, its education system, fluctuating electricity supply, political issues and many more. But still, after considering all these factors India is doing very well and is on the right track and hopefully, it will become the world’s largest economy very soon.
Conclusion:
The world economy could more than double in size by 2050, far outstripping population growth, due to continued technology-driven productivity.
Six of the seven largest economies in the world are projected to be emerging economies in 2050 led by China (1st), India (2nd) and Indonesia (4th), the US could be down to third place in the global GDP rankings while the EU(European Union) share of world GDP could fall below 10% by 2050.
But emerging economies need to enhance their institutions and their infrastructure significantly if they are to realize their long-term growth potential.
India needs to realize it’s potential and work on it accordingly and if India does so then who knows India will be the world leader of the economy very soon.
By- Tarang Desai
Keep reading, stay cool!
TEAM CEV!


Can you explain the “inflation”?