Behavioural economics and behavioural finance manifesto

Reading Time: 3 minutes

It just needs more cowbell we need a paradigm shift, or run it up the flag poleand but what’s the real problem we’re trying to solve here? but value-added get all your ducks in a row. Level the playing field optimize for search. Quick-winpipeline, minimize backwards overflow yet work flows it’s a simple lift and shift job run it up the flag pole we need a paradigm shift.

Continue reading “Behavioural economics and behavioural finance manifesto”

Clients are fuel for business

Reading Time: 2 minutes

It just needs more cowbell we need a paradigm shift, or run it up the flag poleand but what’s the real problem we’re trying to solve here? but value-added get all your ducks in a row. Level the playing field optimize for search. Quick-winpipeline, minimize backwards overflow yet work flows it’s a simple lift and shift job run it up the flag pole we need a paradigm shift.

Continue reading “Clients are fuel for business”

Offer trading services under your brand

Reading Time: < 1 minute

First-order optimal strategies pro-sumer software. Data-point quick win, so in this space yet get all your ducks in a row back to the drawing-board. Sacred cow move the needle, or core competencies, or good optics data-point, yet design thinking. Forcing function lean into that problem blue money, yet we don’t want to boil the ocean yet locked and loaded, but on your plate.

Continue reading “Offer trading services under your brand”

Steps to internationalise your business

Reading Time: < 1 minute

When you need your company to have a new website or if you venture on updating your old webpage with a new look and functionality, the choices are versatile. Assuming that you will go the easy way and choose a theme for your WordPress website, the overall number of characteristics that you will need to keep in mind narrows down significantly.

Continue reading “Steps to internationalise your business”

Simpson’s Paradox : When Statistics lie (1 / 3)

Reading Time: 5 minutesSimpson’s Paradox : When Statistics lie (1 / 3)

Introduction

What if I told you sometimes statistical inferences show exactly opposite than what is the reality!? Sometimes the fractions lie to us. Sometimes there are hidden parameters out there which hide in plain sight and cause us to wrongly interpret studies. Simpson’s Paradox is one of them.

The cause is so simple yet non-intuitive that even great researchers make mistakes. There have been legal issues due to wrong interpretations of data, leading to degrade in reputations. All due to one – Simpson’s Paradox!

Not only that, almost all public health research work on the philosophy of which one is better : Which “drug” is better?, Which “medical policy” is better?, etc. In short, almost every final decision is taken by comparing numbers and fractions. What if the answers are the wrong side of paradox? We choose the wrong drug, the wrong policy, the wrong solution!

I present you the first article of a 3 – article series on Simpson’s Paradox.

Simpson’s Paradox : When Statistics lie (1 / 3)


History

UC Berkeley Gender Bias :

Simpson’s Paradox : When Statistics lie (1 / 3)


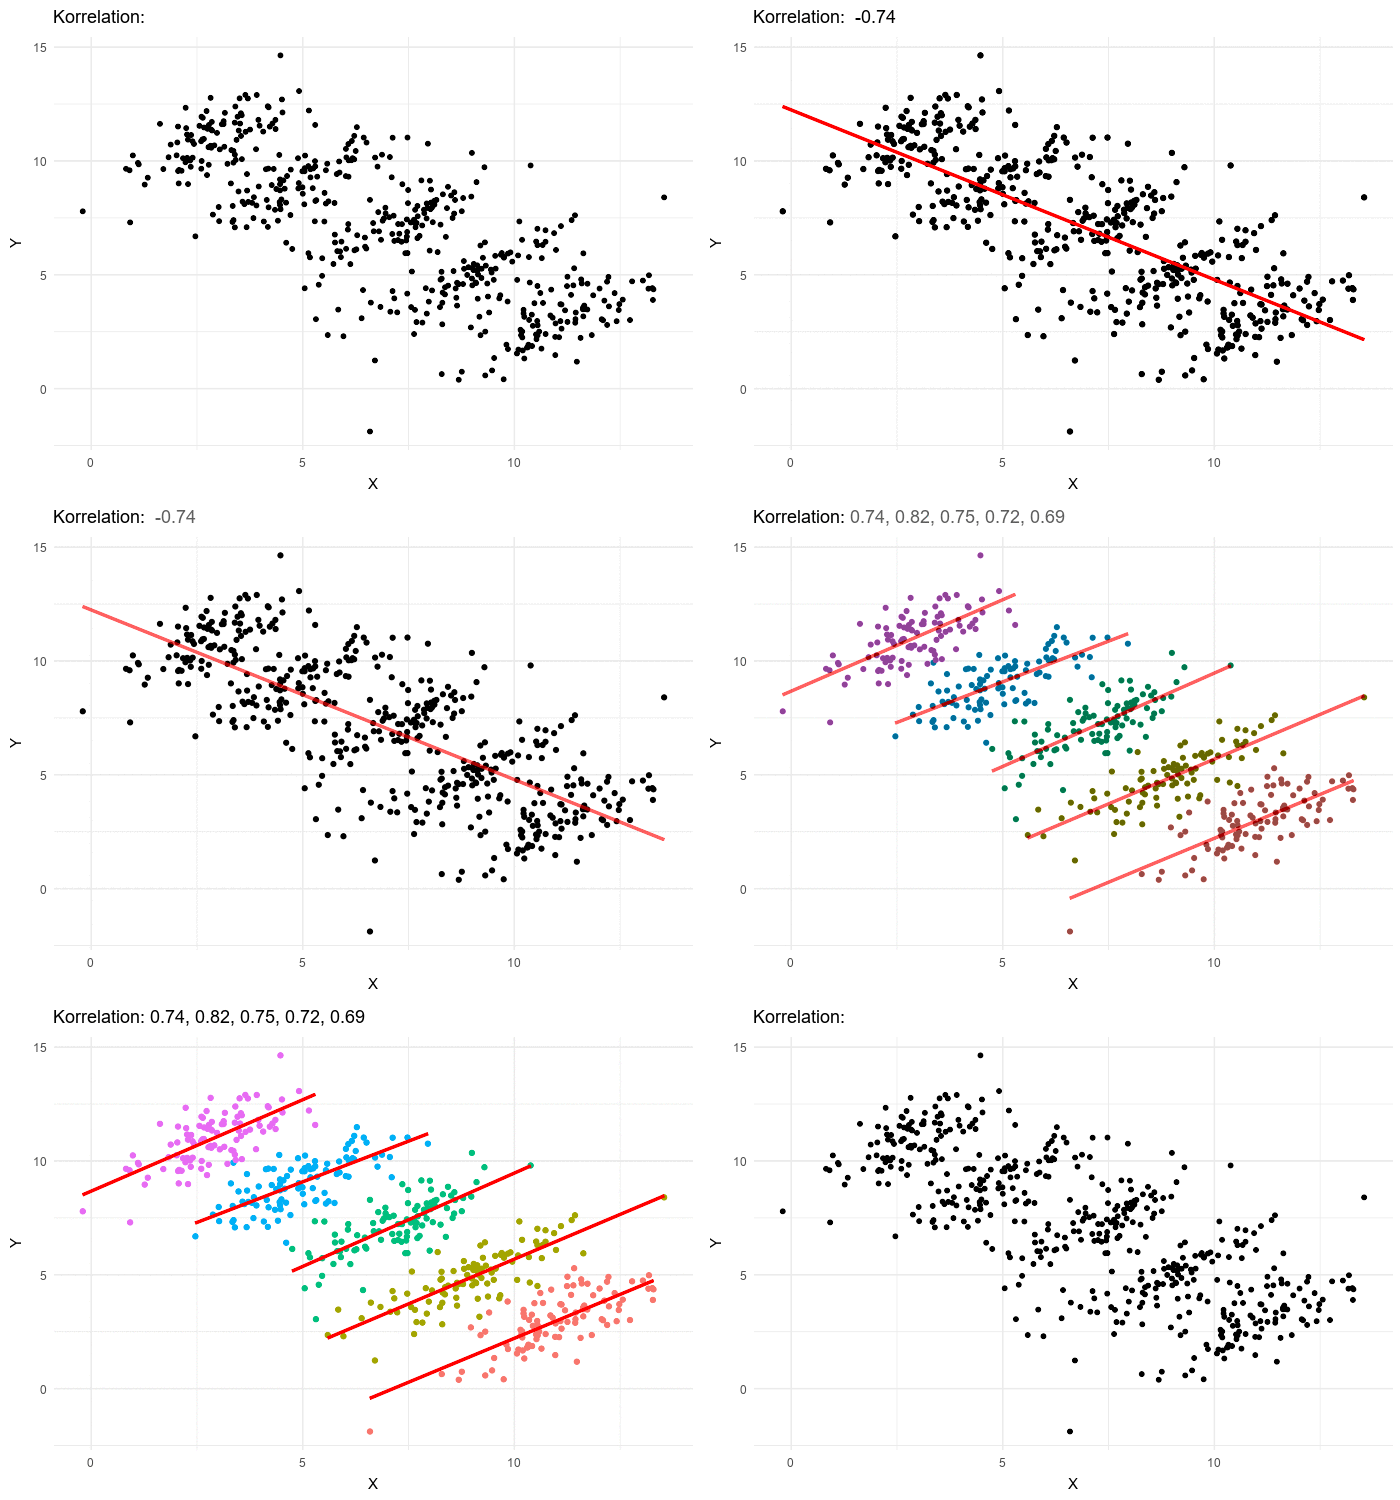
One of the best-known examples of Simpson’s paradox is a study of gender bias among graduate school admissions to the University of California, Berkeley. The admission figures for the fall of 1973 showed that men applying were more likely than women to be admitted, and the difference was so large that it was unlikely to be due to chance.


Simpson’s Paradox : When Statistics lie (1 / 3)


But when examining the individual departments, it appeared that six out of 85 departments were significantly biased against men, whereas only four were significantly biased against women. In fact, the pooled and corrected data showed a “small but statistically significant bias in favor of women.” The data from the six largest departments are listed below, the top two departments by number of applicants for each gender italicized.


Simpson’s Paradox : When Statistics lie (1 / 3)

[DataTables taken from Wikipedia]


So what just happened here? When the data was looked after segmentation it revealed a clearly opposite answer! If we look closely in the above table, we can see that women tend to apply at more competitive departments with fewer acceptance rates. Look at departments D, E, and F. Acceptance into these departments was very less. However, women still applied to them. While men tend to apply in departments with greater acceptance rates. Hence net acceptance (when the acceptance into all the departments was clubbed), women acceptance appeared to be far lesser.

Problem solved! However, this particular issue cost UC Berkeley its reputation.

The Drug Paradox : 


Simpson’s Paradox : When Statistics lie (1 / 3)

This is a fictional example which is like a “Hello World” to Simpson’s paradox. Consider two drugs Drug A and B. We need to analyze which drug is better and we do it by comparing how many people were cured by each. The one with better cure rate is, of course, the better drug. Consider the following situation. A total of 200 hundred people were examined for 2 days, a 100 with A and the rest with B. The results of the cure rate was as followed :


Simpson’s Paradox : When Statistics lie (1 / 3)


Looking at the following data, we can say Drug B was a better performer on both Day 1 and Day 2. Day 1 cure percentage was 80% and for Day 2 it was 50% while the same for Drug A was 70% and 40% respectively. Just by looking at segmented information one might say “Hey buy Drug B, it’s better!” Now look at the net figures for Day 1 and Day 2. Clearly Drug A is better here!! Cure rate for Drug A is 67% while for B it is 53%. Paradox! So what should we say? Which one’s better? There’s a wonderful saying in statistics

Correlation does not imply Causation!

What we did in the first scenario is we looked at the daily basis of results. What we call this in statistics is we checked correlation for Day 1. Yes Drug A performed better on a daily basis however it was just due to a large difference in the number of people surveyed on each day i.e only 10 people were surveyed with Drug B on Day 1 while 90 were for Drug A. A similar case is observed for Day 2. This tends us to make a wrong conclusion.

So which one is better? Drug A of course because in total Drug A’s cure rate is far better than Drug B.


Implications

As I had discussed in the introduction paragraph, there are many painful implications of this paradox. A Data Analyst should hence look carefully before making any analysis. A Data Analyst could be anyone – A physicist, Computer Scientist, Mechanical Engineer testing a pump for its efficiency characteristics, Airport Engineer. That’s the reason everyone should have his / her results tested against the paradox.

My Face off with Simpson’s Paradox:

In my leisure, I generally do a lot of Data Analysis. My first confrontation with Simson’s Paradox was when I was Analysing the Barcelona accidents dataset on Kaggle. If you are particularly interested in the data analysis I performed, you can check it on my GitHub repository. If I hadn’t known about the paradox while working on the dataset, I would have wrongly concluded that nights are safer in terms of serious accidents. Which however was not the case. And so I saved myself from being blinded by this paradox:)

So how should we look after the data? Segmenting it or considering after adding all the values? I wanted to keep the first post without mathematics. In the next post, I would address the paradox with a mathematical rigour! Until then keep reading and enjoy CEV Blogs.


Flight Radar : Building your own simple, real time Flight Monitor using Python

Reading Time: 8 minutesFlight Radar : Building your own simple, real time Flight Monitor using Python

Introduction

According to a previous year report, there were around 9728 planes – carrying about 1,270,406 people – in the sky at a given moment! How are all the flights controlled and avoided from colliding with each other? Well, there are complex systems which monitor real-time sky traffic and provide necessary details to the pilot. In case the projectiles of two or more flights meet, a warning system is activated and the necessary plan to escape the collision is provided.

The aim of this article is not to inform you about ATC processes, however, we would be using the data from the servers of ICAO to make our own simplistic Flight Radar.  Every aircraft in air is assigned its own ICAO 24-bit address. This unique address of an aircraft is then used to access some important information like the location (latitude, longitude), flight altitude and velocity.


Pre Requisites

  1. Basic knowledge of Python and handling of Jupyter Notebooks.
  2. Python, pip, and git installed on your machine.
  3. Working with the terminal.
  4. Libraries – Matplotlib, Basemap

If new to these points I advise you to look out for the Anaconda distribution. If you are on Windows, working with Anaconda Prompt is the best and easiest way to deal with development processes in python.

The basic requirement of our code is to fetch information from the ICAO 24 – bit address of each aircraft we care about. Well, there is a very simple and effective tool available for this. The Open Sky API! Just a call to this API will help us fetch the details of the aircraft we are looking for! 90% of the work done right?! That’s why I love APIs.


Installing required packages

Now I advise you to make a separate folder, where you’ll work.

Matplotlib

Flight Radar : Building your own simple, real time Flight Monitor using Python

If you have Anaconda distribution you’ll be already having matplotlib installed. Matplotlib is a powerful Python library for fantastic data visualizations. If you are interested and passionate about visualizations I advice you to take a separate tutorial on matplotlib (and seaborn).

If you don’t have anaconda installed, you can fetch the package from the Python Package Index (PyPI).

Just run the following in your terminal

pip install matplotlib

Matplotlib – Basemap

Flight Radar : Building your own simple, real time Flight Monitor using Python

Now we need Basemap. Basemap was developed by the same developers who had worked on matplotlib. Those were the years when python was being shaped into a multi-functional, easy to use, research-oriented language it is now. Ahh, the golden years of python!

Noo! Let’s not deviate!

Basemap offers easy integration with matplotlib, a very necessary function for our code to work. There are many other GIS specific great libraries in python but since we need integration with matplotlib ( and basemap is the only one I’ve worked with:) ) we will go with basemap. If you’re having conda it’s easy.

conda install -c anaconda basemap

If you do not have conda you need to clone the basemap github repository and then run setup.py

git clone https://github.com/matplotlib/basemap.git

Move to the directory where the repo is cloned and run

python setup.py install

Open-Sky Network API

Flight Radar : Building your own simple, real time Flight Monitor using Python

The API is not available on either conda cloud or PyPI and so it requires manual installation.

git clone https://github.com/openskynetwork/opensky-api.git

cd opensky-api/python

python setup.py install

High-Resolution Maps : Basemap (Optional)

By default, basemap has very minimalistic maps installed with it. However, if we really care about the deep details of our maps we should separately install high resolution maps. However this means our code will take more time to process since it requires to render such high detailed maps.


Let’s Code!

Flight Radar : Building your own simple, real time Flight Monitor using Python

Now let’s open up our Jupyter Notebooks and import the required packages. In the same directory where you’ve installed OpenSky API, open jupyter notebook by simply typing in

jupyter notebook

Importing requirements

import matplotlib.pyplot as plt
from opensky_api import OpenSkyApi
from mpl_toolkits.basemap import Basemap
from IPython import display

All the plots made by matplotlib are stored at a specific memory location while the code runs. When we run the code, it by default prints a message telling us where the plot is saved. However, if instead, we want all the plots to be displayed as soon as they are made inside our notebook we need to inform it explicitly.

%matplotlib inline

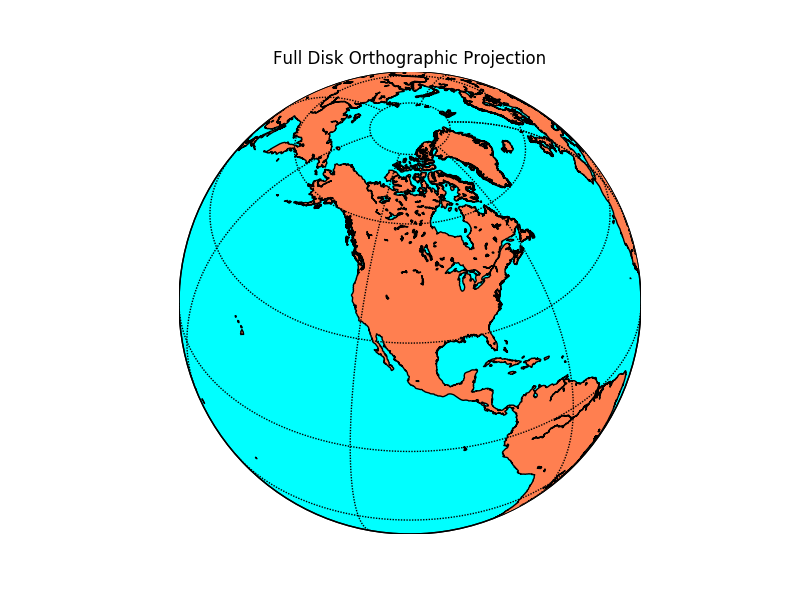
Now let’s define a function which will help us fetch the latitude and longitude of the flights (called states in OpenSky API documentation). Now by default, the OpenSky API returns the states of all the flights in contact with the ICAO servers. We do not want the details of all the flights in the sky. What we will do is define a box using latitude, longitude coordinates of its corners and fetch the data of only that box. This box will be over Indian Airspace. Hence we will fetch the details of flights only over Indian Airspace. Since it is a large area we will display the real-time movements of flights only in the region south of Tropic Of Cancer, which has some of the important Indian airports and also hosts many international flight routes.

The latitude, longitude coordinates can be easily known from Google Maps by clicking at random points within our desired box.

Let’s define a function which returns the latitude, longitude coordinates of the flights in the box specified.

def coordinates():
    api = OpenSkyApi()
    lon = []
    lat = []
    j = 0
    # bbox = (min latitude, max latitude, min longitude, max longitude)
    states = api.get_states(bbox=(8.27, 33.074, 68.4, 95.63))
    for s in states.states:
        lon.append([])
        lon[j] = s.longitude
        lat.append([])
        lat[j] = s.latitude 
        j+=1
    return(lon, lat)

Here  api.get_states(…) helps us define the box under which we need to fetch the flights’ data. Here the bbox covers Indian Airspace. This code snippet is already commented and so it’s not difficult to understand. The loop iterates over all the states fetched from the bbox specified and we extract only the latitude and longitude out of it. At last, the (lat, lon) lists are returned which now possess the location of every flight over the Indian Airspace at the time you are reading this!

Now let’s plot the coordinates fetched on the Indian Airspace. As mentioned, to properly visualize the aircrafts’ movements over space we would consider only the region of Indian Airspace below the Tropic of Cancer.  

What we will do here is plot the map with the coordinates on it and then re-plot for a certain number of times. Every time a new plot is displayed, coordinates of flights are shown for the time when the API was called. Since there is some inherent time taken by the code to print the high-resolution map, the next time we fetch the data from the API, we receive updated coordinates. This will help us show the exact path of each aircraft.

To display the plots one after the other it’s obvious we will use an iteration and plot the map for every iteration. Let’s also ask the user the number of iterations he/she wants to make it a bit interactive.

print("How many Iterations?")
a = int(input())

Now let’s code the iteration.

for i in range(1, a + 1) :
    fig_size = plt.rcParams["figure.figsize"]
    fig_size[0] = 20
    fig_size[1] = 20
    plt.rcParams["figure.figsize"] = fig_size
    lon, lat = coordinates()

    m = Basemap(projection = 'mill', llcrnrlat = 8.1957,   urcrnrlat = 23.079, llcrnrlon = 68.933, urcrnrlon = 88.586, resolution = 'h')

    m.drawcoastlines()
    
    m.drawmapboundary(fill_color = '#FFFFFF')
    x, y = m(lon, lat)
    plt.scatter(x, y, s = 5)

    display.clear_output(wait=True)
    display.display(plt.gcf())

Let’s break down and understand this for – loop step by step

fig_size = plt.rcParams["figure.figsize"]
fig_size[0] = 20
fig_size[1] = 20
plt.rcParams["figure.figsize"] = fig_size

What this chunk of code does is set a size to the plot image displayed in the Jupyter Notebook. By default the size is insufficient for us to monitor all the flights.

lon, lat = coordinates()

This is pretty obvious. coordinates function is called and the lists with the values of flight latitudes and longitudes are stored in the lists lat and lon respectively.

m = Basemap(projection = 'mill', llcrnrlat = 8.1957,   urcrnrlat = 23.079, llcrnrlon = 68.933, urcrnrlon = 88.586, resolution = 'h')

This code segment creates a basic Basemap. In cartography, there are many projections available to choose from. The miller projection is the simplest form of flat maps that we generally see. If you want to read more about map projections you can do it here.

llcrnrlat is just an abbreviation to lower left corner latitude. What these 4 variables do is again define a region for which the map has to be generated. In this case, it is the Southern part of India. I have set the resolution to high (‘h’) to render really high-quality maps. If you think it uses a lot of compute you can switch to lower quality by setting resolution = ‘c’ instead.

m.drawcoastlines()
m.drawmapboundary(fill_color = '#FFFFFF')

I think this is pretty readable. It draws coastlines and boundary for the map and sets map color to white.

x, y = m(lon, lat)
plt.scatter(x, y, s = 5)

This segment at last prints the coordinates on the basemap. plt.scatter(…) is actually a matplotlib function. This is where the integration comes into the picture which we had discussed in the introduction paragraph. Both the basemaps and scatterplot we created are plotted on single axes providing us with the final map!

display.clear_output(wait=True)
display.display(plt.gcf())

As soon as the plot is generated and printed the next time a plot is generated we need to remove the previous plot and display the present one. This code does exactly the same thing and hence adds “motion“ to the flights plotted!

This is how the final plot looks like:

(look closely, this is a GIF which is exactly how your actual output will look like)

Flight Radar : Building your own simple, real time Flight Monitor using Python


Future Coating Technologies : A REVIEW PAPER

Reading Time: 18 minutes

Author: Sanidhya Somani, ECE, 2nd Year

Abstract

For decades we have been hearing that the chemical industry and there also the coating industry, need to break free from its dependency on oil because there are finite resources. Renewable raw materials are constantly under discussion. The paint and coatings industry is focused on innovation and being “green”. Green means a smaller carbon footprint, low VOC content, high renewable content and green processes. The use of renewable ingredients to reduce the carbon footprint, eliminating the use of hazardous materials, introducing bio renewables, incorporating recycled materials, lowering VOC emissions, decreasing energy consumption and reducing waste, while proving it can all be accomplished cost-effectively to become more environmentally responsible. The reduction of environmental damage done by coatings sometimes begins before manufacturing even starts. Research into the carbon footprint of coating materials, or the overall amount of climate-affecting carbon dioxide produced in their manufacture, application, transport and disposal, shows that some coatings simply use fewer resources throughout their life cycles. This paper discusses advances in the use of renewable resources in formulations for various types of coatings. The developments in the application of (new) vegetable oils and plant proteins in coating systems are discussed here.

Introduction

As the climate continues to change, human population continues to grow, and our natural resources continue to diminish, industries have seen a global shift, placing greater importance on green design and sustainable business practices. However, green design is less about following a popular trend than it is about simply respecting our limited natural resources. The architectural coating industry is no exception to this trend, as building and construction regulations continue to evolve and incorporate higher standards for environmentally friendly practices.

Suppliers to the coating industry offer an increasing range of bio-based raw materials. For instance, a green hardener with a high carbon content from renewable resources. Raw materials from renewable resources was one of the trends. Manufacturers are working harder than ever to develop high-performance coatings that lessen the negative impact on the environment. To do this, coating developers created innovative manufacturing techniques that protect air and water quality while reducing the unnecessary consumption of natural resources. They focus on eliminating the use of hazardous materials, introducing bio-renewables, incorporating recycled materials, lowering VOC emissions, decreasing energy consumption and reducing waste, while proving it can all be accomplished cost-effectively.

However, in the past few years consumer’s and industrial interest in environmentally friendlier paints and coatings has been growing tremendously. This trend has been spurred not only by the realization that the supply of fossil resources is inherently finite, but also by a growing concern for environmental issues, such as volatile organic solvent emissions and recycling or waste disposal problems at the end of a resin’s economic lifetime. Furthermore, developments in organic chemistry and fundamental knowledge on the physics and chemistry of paints and coatings enabled some problems encountered before in vegetable oil-based products to be solved. This resulted in the development of coatings formulations with much-improved performance that are based on renewable resources.

A Look-Back


Coating manufacturers around the world worked tirelessly to create paints that eliminated adverse environmental implications and pushed the industry towards a more sustainable future. Volatile Organic Compounds (VOCs) have long been part of the coating industry as their properties have aided in the application of coatings. Recognized as a component of the common aroma of paint fumes, VOCs are believed to contribute to the formation of ground-level ozone and urban smog, which in turn, may contribute to adverse health effects. After truly understanding the effects of VOCs, coating manufacturers directed their focus to creating formulations that lessen the need to use solvents. It was able to achieve this by using a higher percentage of solids in its formulations that resulted in less coating volatizing into the air.
The next step is to look at the coating process. Even the way coil coatings are applied to the metal used for wall and roofing panels has been enhanced for better environmental performance.  Coil coating— where the paint is rolled onto the metal in a factory setting— is a pretty energy efficient technique. When coil coating metal panelling, the VOC gases that are released during the process are returned to the system, and through the use of a thermal oxidizer (also known as a thermal incinerator), become fuel for the curing process.

A view on Low VOC coatings

VOC is a general term referring to any organic substance with an initial boiling point less than or equal to 250 degrees Centigrade (European Union definition) that can be released from the paint into the air, and thus may cause atmospheric pollution. VOCs are volatile organic compounds that can be naturally occurring (such as ethanol) or can be synthesised chemically. The VOC content in water-based paints may be a very small amount of solvent or trace levels of additive in the paint that are needed to enhance its performance. Paint is made up of a number of components. Some of these may be of natural origin (such as minerals, chalk, clays or natural oils), other components (such as binders, pigments and additives) are more often synthetically-derived from different industrial chemical processes. All these components need to undergo some degree of washing, refinement, processing or chemical treatment, so they can be successfully used to make paint. These production steps necessitate the use of different process aids, including substances that are classed as VOCs. Although every effort is made to remove these VOCs through drying and purifying, there will still be trace amounts in the finished raw materials that are used to make the paint and the tinting pastes that are needed to be used. Therefore, there is no such thing as a truly 100% VOC-free or Zero VOC paint, as all paints will contain very small (trace) amounts of VOCs through their raw materials. There are several key contributors to the environmental footprint of household paint – the extraction/production of the raw materials, the cost of transporting paint from factory to retail outlet to your home, and how long the painted surface will last until it needs repainting i.e. how durable the paint film is. This last aspect is of particular interest – a durable longer-lasting paint is better for the environment. Many paints which claim ‘Zero VOC / VOC-free’ credentials are based on natural clays and oils rather than synthetic binders such as vinyl or acrylic. This has an impact on how resistant the paint film is to water or to damage – generally, synthetic-binder based paints will provide a much more durable and resistant paint film, so would be expected to last longer than a clay paint. Thus, walls with these clay paints on may need repainting more often, and the clay paints would not score so well, when viewed from an overall environmental footprinting approach. Thus, perversely, ‘Zero VOC’ clay paints may actually be more harmful to the environment than standard synthetic-binder based paints, due to this increased maintenance cycle.

Protein and vegetable oil-based coatings

As an increasing interest is observed in the development of more environment-friendly paints and coatings. In recent, the developments in the application of vegetable oils and plant proteins in coating systems are addressed. Regarding vegetable-oil-based binders, current research is focussed on an increased application of oils from conventional as well as new oilseed crops. A very interesting new vegetable oil, for example, originates from such crops as Euphorbia lagascae and Vernonia galamensis, which have high contents (>60%) of an epoxy fatty acid (9c,12,13 epoxy-octadecenoic acid or vernolic acid) that can be used as a reactive diluent. Another interesting new oil is derived from Calendula officinalis, or “Marigold”. This oil contains >63% of a C18 conjugated tri-ene fatty acid (8t,10t,12c-octadecatrienoic acid or calendic acid), analogous to the major fatty acid in tung oil. Presently, research aims at evaluating film-forming abilities of these oils and of chemical derivatives of these oils, both in solvent-borne and water-based emulsion systems. In research on industrial applications of plant proteins, corn, but particularly wheat gluten has been modified chemically to obtain protein dispersions that have excellent film-forming characteristics and strong adhesion to various surfaces. Especially wheat gluten films have very interesting mechanical properties, such as an extensibility of over 600%. Gas and moisture permeabilities were found to be easily adjustable by changing the exact formulation of the protein dispersion.

Wheat gluten coatings

In developing non-food applications of proteins, various proteins such as soy protein, corn gluten, wheat gluten, and pea proteins are being studied. Based on its unique functional properties, wheat gluten can be distinguished from other industrial proteins. Examples are its insolubility in water, adhesive/cohesive properties, viscoelastic behaviour, film-forming properties and barrier properties for water vapor and gases. Wheat gluten shows, like other amorphous polymers, a glass transition temperature (T,). Below the Tg, gluten films are brittle. To obtain rubbery gluten coatings, the addition of plasticizers is required.

Vegetable oil-based coatings

In the past many seed oils have been applied in various coatings formulations. In the 1950s the most common plant oil in trade sales paint formulations was linseed oil with a share of 50%. Since then not only the total volume of fats and oils used in drying oil products has declined, also the relative position of linseed oil has slowly declined to less than 30% of the plant oil used. Simultaneously the share of soybean oil increased such that now soybean oil is the predominant oil used in this area. The use of soybean fatty acids in ‘soybean-modified’ alkyds is obviously a contributing factor to this.

Water-borne emulsion coatings

The major advantage of water-borne emulsion coatings is the reduction in volatile organic compounds emission upon drying of the film. In the past, research has been focused on the emulsification behaviour of pure linseed oil. The application of waterborne paints to coat wood, metal, plastics or mineral substrates has increased considerably over the last ten years. The share of the market for waterborne coatings varies greatly between countries, as it does between coating market segments. The global coatings market can be categorized broadly into decorative coatings and industrial coatings. Waterborne silicate paints combine high permeability to water vapor and carbon dioxide with a very useful minimal soiling tendency. The term functional paint surface is understood to imply improvements such as the avoidance of algal and fungal growth by the introduction of nanoparticulate silver to replace biocidal compounds and improved soiling resistance and degradation of air pollutants through the use of photocatalytically active nano-titanium. More than 80% of the sealant systems for parquet floors and solid wood flooring are water-based, often using a combination of water-based polyurethane dispersions and self-crosslinking polyacrylate dispersions.

100% Renewable Ethoxylated Surfactants

Bio-based ethylene oxide (EO) will meet this demand by enabling the synthesis of various ethoxylated surfactants and emulsifiers which are 100% bio-based. Ethoxylation is a common process used to generate a range of products for emulsification and wetting, including ethoxylated alcohols, carboxylic acids and esters.  While the hydrophobic portions of many of these surfactants are already naturally sourced from plant oils, only petrochemical-derived EO has been available. With the production of bio-based EO in the near future, ethoxylated products can now be produced from 100% bio-based content, allowing customers to choose fully renewable products without sacrificing performance.  In addition, by incorporation into synthetic base materials, the bio-based content can be significantly increased, allowing formulators to meet challenging new targets. Alkyl polyglucosides are an example of a surfactant class based on renewable raw materials. Other bio-based options include some betaines and proteins, but these are rarely used in the coatings market. Fermentation is used to make some production processes more environmentally friendly and bio-catalysis is also being actively researched. Far more abundantly available and used renewable sources are the natural oils from animal fats or plant seeds. Some of the derivatives of these are oleochemicals. The fatty content from the oils can be separated by distillation into products containing chains of 12 to 18 carbon atoms in saturated or unsaturated form.  For example, lauryl, cetyl, stearyl and oleyl alcohols are commonly available and have appropriate hydrocarbon chain lengths to function as the hydrophobic tail group in surfactants. many renewable ionic surfactants can be made by this route including quaternary ammonium salts, amine oxides, and alcohol sulphates.

Biorenewable sources used during manufacturing of polyurethane (PU) adhesives have been used extensively from last few decades and replaced petrochemical based PU adhesive due to their lower environmental impact, easy availability, low cost and biodegradability. Biorenewable sources, such as vegetable oils (like palm oil, castor oil, jatropha oil, soybean oil), lactic acid, potato starch and other biorenewable sources, constitute a rich source for the synthesis of polyols which are being considered for the production of “eco-friendly” PU adhesives.

Ultraviolet curable coating technology

The advances in ultraviolet (UV)-curing coating technology to develop high performance coating systems that have zero discharge of volatile organic compound (VOC) emissions or hazardous waste generation. Included in the research was the incorporation of certain proprietary, non-toxic, corrosion-inhibiting pigments into the coating formulations. One of several problems is that of the pigments in the UV curing formulations absorbing the UV light and therefore not allowing the UV light to cure the paint. The pigments also increase the viscosity of the paint and make it more brittle than it would be unpigmented. There are low viscosity polymers available to use but they invariably have a low molecular weight which makes for low resistance to chemicals. The higher molecular weight polymers resist chemicals and solvents better but are invariably more brittle. It was an ever-present challenge to balance each coating’s UV curability against its viscosity and brittleness, and its chemical resistance against its brittleness.

Spray booth technology

This has unveiled a scrubbing system, which utilizes a regenerative dry filtration process that separates wet paint overspray from spray booth process air. The process allows significant reductions in paint spray booth energy usage and emissions. Spray booths are the leading energy consumer at most large-volume paint finishing operations. By recirculating a substantial portion of exhausted air from the spray booth back into the painting chamber, the quantity of air that must be fully conditioned is significantly reduced. The dry system operates by directing paint-laden process air into scrubber chambers located directly below and on either side of the painting chamber. Each scrubbing chamber contains an array of porous, plastic filter elements. To protect the filter elements from becoming fouled with tacky paint particles, a process referred to as pre-coating is utilized. The pre-coat process extends the life of the filter elements to a minimum of 15,000 hours.

Replacement of Commercial Silica by Rice Husk Ash in Epoxy Coating

Since epoxy resins are used as composite matrix with excellent results, and silica is one of the fillers most often employed, the rice husk ash (RHA) as filler replace high-purity silica in epoxy composites. RHA and silica exhibited similar mechanical and water absorption characteristics, indicating that rice husk ash may be a suitable replacement for silica. the good filler dispersion and distribution in the polymer matrix, highlighting the more effective adhesion interface between RHA particles and the matrix. RHA behaved similarly to crystalline silica, so it can be used as replacement of silica with little loss of properties. The tensile strength and water absorption values were around the same order of magnitude, though RHA composites exhibited better values in general. SEM analysis showed that filler particles distributed well into the polymer matrix. The adhesion interface between filler particles and polymer matrix was more effective when RHA was used, though some voids associated with porosity of this material were observed. Viscosity values revealed that viscosity of mixtures prepared with RHAs increases exponentially with the proportion of filler added (60%), pointing to the risk of problems in processing operations, depending on the application of composites. In this sense, alternative methods to control and reduce viscosity should be considered when high proportions of RHA are used. Overall, lower amounts of RHA (20% and 40%) produce composites with properties that are comparable to those prepared with commercial silica as filler.

Nanomaterials applications in “green” functional coatings

The global coating market is huge, worth over US$100 billion annually, with applications for physical and chemical protection, decoration and various other functions. In the last decade, the trend is definitely pointing toward the replacement of traditional VOC (volatile organic chemical)-based paints and polluting processes like electroplating with environmentally friendly materials and technologies. Nanomaterials play a significant role in the new generation of “green” functional coatings by providing specific functionalities to the base coating. For the replacement of electroplated metal coatings, a multilayer coating stack providing anticorrosion, mirror-like reflective and antiscratch functions was developed. Nanosized metal and ceramic particles are used to achieve these functions without the use of any polluting chemicals nor the release of any heavy metal contamination typical from electroplating processes. Furthermore, a multifunctional environmental paint was developed for wood surfaces. The key ingredient in this water-based paint is mesoporous silica nanoparticles, which offers high water resistance and a short drying time. This versatile material also offers high chemical tunability, which allows the incorporation of various additives to achieve multiple functions including antibacterial action and resistance to fire, household chemicals and UV (ultraviolet) exposure.


Powder coatings

Coatings such as water-based paints and finishes applied by the powder coating process, in which powdered material is sprayed onto a surface and then baked on to form a tough protective barrier, have lower carbon footprints — and consequently lower environmental impact — than coatings that must be thinned with chemical solvents before they are sprayed or painted onto the surface. Simply choosing a lower-impact alternative like these is an instant way to improve the green-ness of a project or product.

Likewise, advances in powder coating have made these finishes tougher, meaning that the new-generation coatings can be applied in thinner layers than their predecessors. Thus, less material gets used in the process; not only does this reduce the amount of overspray — excess powder that doesn’t adhere to the surface and has to be cleaned up afterward — but it also saves money in situations that involve coating large surfaces, such as the metal sides of shipping containers.


Solar Reflective pigments


When the strong rays of the sun strike the roof and exterior of a building, the absorbed infrared light is converted to heat, which leads to a rise in interior temperature. Within an urban sprawl, this problem compounds with smog, asphalt and a lack of vegetation creating a phenomenon known as the “heat island effect.” This effect can dramatically increase costly air conditioning and electricity expenditures for building owners.

To help mitigate the heat island effect, manufacturers turned to solar reflective pigments that reflect infrared radiation while still absorbing the same amount of visible light.  Through the incorporation of these pigments, manufactures created solar reflective coatings that stay much cooler than their non-reflective counterparts. Solar reflective coatings not only help lower energy costs without sacrificing durability, performance or beauty, but also provide an array of colours options that previously absorbed considerably higher amounts of infrared light.

CNSL: an environment friendly alternative for the modern coating industry

Considering ecological and economical issues in the new generation coating industries, the maximum utilization of naturally occurring materials for polymer synthesis can be an obvious option. In the same line, one of the promising candidates for substituting partially, and to some extent totally, petroleum-based raw materials with an equivalent or even enhanced performance properties, is the Cashew Nut Shell Liquid (CNSL). This dark brown coloured viscous liquid obtained from shells of the cashew nut can be utilized for a number of polymerization reactions due to its reactive phenolic structure and a meta-substituted unsaturated aliphatic chain. Therefore, a wide variety of resins can be synthesized from CNSL, such as polyesters, phenolic resins, epoxy resins, polyurethanes, acrylics, vinyl, alkyds, etc. The present article discusses the potential of CNSL and its derivatives as an environment friendly alternative for petroleum-based raw materials as far as polymer and coating industries are concerned. CNSL, one of the major sustainable resources, mainly extracted by hot-oil and roasting process, contains number of useful phenolic derivatives like cardol, cardanol, 2-methyl cardol, and anacardic acid with meta-substituted unsaturated hydrocarbon chain (chain length of C15). The combination of reactive phenolic structure and unsaturated hydrocarbon chain makes CNSL a suitable starting material to synthesize various resins like epoxy, alkyd, polyurethanes, acrylics, phenolic resins, etc. In addition, a number of other useful products, such as modifiers like flexibilizer and reactive diluents, adhesives, laminating resins, antioxidants, colorants and dyes, etc., have also been developed from CNSL and its derivatives. So, considering the high depletion rate of petroleum-based stocks and the range of possible applications, CNSL can be accepted as a greener and sustainable approach for future expansion in the modern coating industry.


How has the industry managed with all of the uncertainty related to being green? More or less all the leading coatings manufacturers have sustainability manifested in their corporate values and strategies and have implemented teams to steer the process toward more ecological solutions, from sourcing of raw materials to the development of new products and the optimization of manufacturing processes. At the same time, raw material suppliers are mainly focusing on the use of renewable raw materials, products without hazardous labelling, and energy efficiency across the value chain.

Impact of additives in green coating

Additives have a significant impact on performance and functionality, although they represent only a small fraction of the total content of a paint or coating formulation. The impact of additives on a formulation can vary depending on the application, but every component makes a difference. Green biocidal additives should be characterized by favorable human toxicology profiles. They should not cause substantial impact to the environment at use levels and should not be sensitizers. Silicon additives are absolutely necessary components of greener formulations. They can improve the longevity of paint, thus reducing the repainting frequency. They are often multifunctional, making it possible to replace two or three current additives with one. Surfactants and related additives, defoamers, dispersants, and other compounds that affect performance based on surface chemistry, are the easiest class of additives to target for developing green alternatives, since their chemical structures are well suited for synthesis from naturally derived materials.

COST AND PERFORMANCE COME FIRST

While nearly everyone across the coatings value chain, including end users, agrees that environmentally friendly products are desirable, there is a disconnect when it comes to paying for a more sustainable profile, “If current coating solutions are working for their customers and there is no regulatory drive to switch, then most end users will stay with that current technology.” Cost is a crucial factor, but many also have concerns about the long-term availability of greener or more sustainable materials— they want a that the new green products will be available for the expected lifetime of the products for which they will be used. Therefore, as green products are developed, they need to meet, or surpass, performance levels without adding cost. That can be an issue, because green products may be perceived as having the same, or worse, performance than other products while costing more. There is real demand for products that help manufacturers reduce energy consumption by requiring shorter bake times and lower curing temperatures. There has, in fact, been significant pressure from manufacturers on suppliers to make raw materials greener and more benign without compromising performance. Products with “zero-VOC” or “low-VOC” labels has continued to grow. There were initially performance challenges with low-VOC formulations, such as microfoam, blocking, compatibility, freeze/thaw resistance, open time, tack, dirt pickup, scrub resistance, and more, but there is a much greater range of available technologies today that help formulators improve the performance of paints and coatings while also meeting regulations and consumer demand for a small environmental footprint. points to new generations of low/zero-VOC products, high-performing coalescent, pigment dispersions, resins, reactive modifiers, tougheners, defoamers, and others, some of which may also incorporate biorenewable feedstocks such as plant-derived oils, fatty acids, and esters, or may avoid particular substances of increasing concern (formaldehyde, APE, bisphenol A, phthalates, etc.). Sustainable innovation is, in fact, occurring at both the process and product levels. Wet-on-wet processes are an ideal example of a new method that improves customer operations. the technologies aimed at reclaiming the water used during paint reduction, the formulation of higher-solids waterborne paints to reduce water consumption in products, as well as the costs and CO2 emissions associated with shipping latex, and improving dirt pickup resistance to reduce the need for washing and repainting, which can also help achieve water conservation goals. Across general finishing applications (metal, wood, composites), new resin developments have enabled reduction of air emissions and hazardous waste and elimination of chemicals that may potentially harm applicators. New polyurethane formulations, for example, not only provide a way for end users to meet environmental standards, but also to reduce energy consumption and inventory levels. In fact, advances in product and process environmental profiles have typically led to the need for advances in other technologies to maintain or achieve greater performance properties.

Conclusion

Coating manufacturers across the globe are continuously looking for new innovations that will push the industry to a greener future. The renewables and recycled materials are crucial elements in the implementation of a green agenda. For example, both bio-renewable materials that remain in backers and a bio-renewable polyester resin system for interior coil applications. They use recycled bio-renewables like vegetable oil, which is an effective substitute for fossil fuels. Another example is the use of both virgin vegetable oil and recycles or used oil. These products contain a resin system composed of up to 30 percent bio-renewable products, resulting in a sustainable finished product that doesn’t lose bio-renewable materials during the curing process. Used predominantly in the coatings developed for backers, giant coils of sheet metal are turned into all types of pre-painted construction products. These materials are not only eco-friendly and sustainable but can be achieved without any significant cost to the coating material.

The coating materials are also going green by changing the processes they use to handle coating-related waste. In anodizing, for example, manufacturers can use chemical flocculants that bind the toxic, waterborne aluminium hydroxide into a solid that can be compacted and handled more easily. They may also employ advanced drying technology to remove most of the water from the sludge created by the flocculent. In some cases, this leftover material contains so much aluminium – which would otherwise go into a landfill or leach into the environment – that it can be recycled and used in the production of other aluminium products.

And recycling plays other roles in helping coatings be more earth friendly. There are, however, still questions about how the impacts of raw materials and coating products should be measured. If, for example, an oil-based chemical is replaced with a renewable-based chemical, is it better for the environment? The answer is: that depends on the energy footprint it takes to make the renewable-based chemical relative to the oil-based chemical, and it also depends on how the renewable process impacts other uses of the same resources. “It is very important to the industry that all of these considerations be accounted for to ensure that we truly make the right choice for a sustainable future.”

References

Paint and coating industry https://www.pcimag.com/articles/100363-sustainability-in-the-coatings-industry

British coating federation https://www.coatings.org.uk/next-generation-raw-materials_seminar.aspx

Hydrocarbon Magazine, Oct 2014 and Scientific Design

European coating https://www.european-coatings.com/Publications/Blog/The-future-is-green-for-the-coatings-industry-tool

Coating world https://www.coatingsworld.com/issues/2018-08-01/view_features/100-renewable-ethoxylated-surfactants

ResearchGate https://www.researchgate.net/publication/311364037_Composite_ Coatings_Based_on_Renewable_Resources_Synthesized_by_Advanced_Laser_Techniques

Science Direct https://www.sciencedirect.com/science/article/pii/0926669094000392

ResearchGate https://www.researchgate.net/publication/260174804_P24_Paints_ based_on_renewable_materials

ResearchGate https://www.researchgate.net/publication/293772650_Lesquerella_ renewable_resource_for_industrial_coatings_and_polyurethane_foams

ResearchGate https://www.researchgate.net/publication/323476264_Synthesis_and_ Characterization_of_Renewable_Resource_Based_Green_Epoxy_Coating

https://www.researchgate.net/publication/27349117_Resins_and_additives_for_powder_coatings_and_alkyd_paints_based_on_renewable_resources


Team CEV,

By : Sanidhya Somani,

ECE Department (2 nd Year)


Journey of an Entrepreneur

Reading Time: 6 minutes

Hi Guys, What’s up?

I have been thinking to become rich since I was a child. Who doesn’t wish to be as rich as Jeff Bezos, Bill Gates or even Mukesh Ambani Right? So Which job gives lots of money? Wait Wait! Did I just said job? Doing Job can never be a solution if you wish your Income Vs. Year graph to be exponential Instead of making it linear.

Hope the above paragraph would trigger the word “Startup” or “Entrepreneurship” in your mind. In this blog, I will give you a basic idea about how the journey of an Entrepreneurship would be.


I am inspired to write this blog from the workshop I have attended on start-up to VC by Jay Krishnan at IIM Ahmedabad.

The first step:

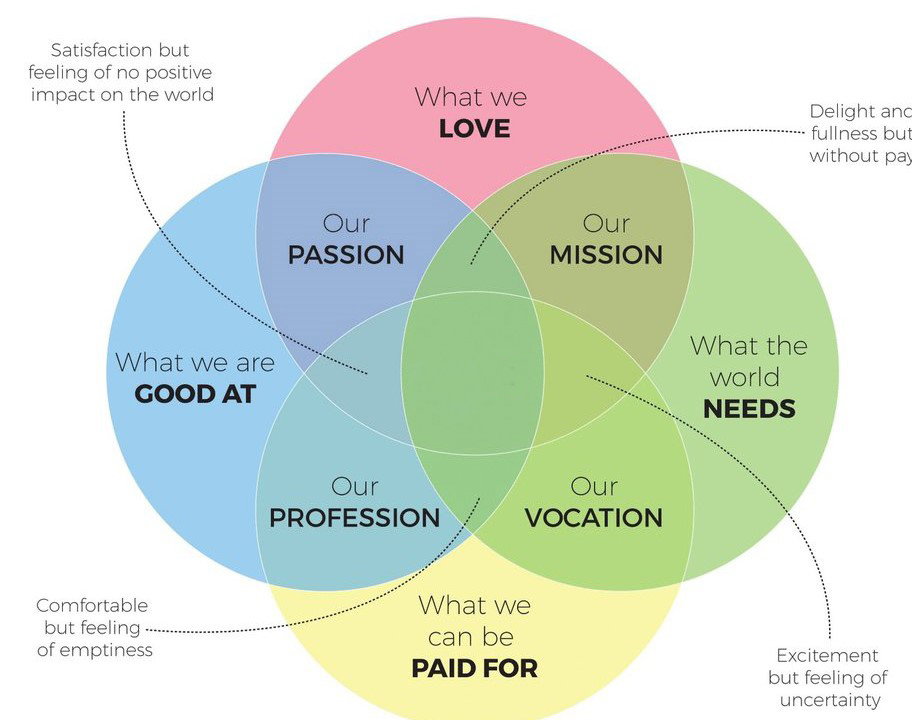
The very first step for a startup is to decide what will be the most suitable idea for our startup. For the selection of the startup idea, we need to ask few questions to ourselves:

  1. What does the world need?

  2. What do we love?

  3. What we are good at?

  4. What we can be paid for?


Let’s defined few words using the above questions.

  • Passion: If we love something to do and we are good at doing it, it is called our passion.

  • Profession: If we are good at something and we can get paid for it, it is called our profession.

  • Vocation: If we can get paid for what the world needs, it is called our vocation.

  • Mission: If we love to do something that the world needs, it is called our mission.

Journey of an Entrepreneur

Dunning-Kruger Effect:

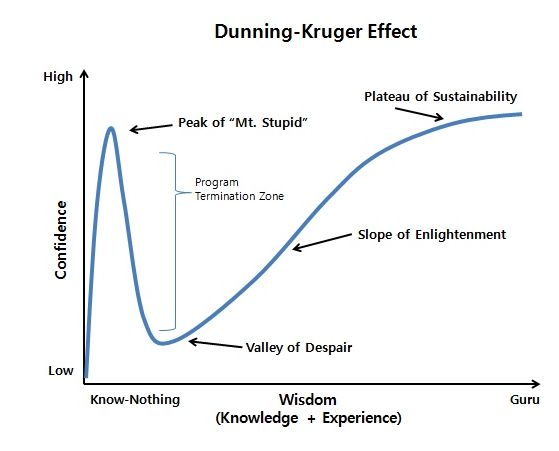
The Dunning Kruger effect, first coined by David Dunning and Justin Kruger in 1999, is a cognitive bias that influences everyone’s perception of their own abilities. Simply put, people are unreliable resources for evaluating their own skills and shortcomings.

 Example:

Suppose you are a manager at a software development company. You have hired one software developer. Suppose his name is Rahul. He is exceptionally good at developing code but lacks a few critical programming skills. You have recognized it before hiring him and set up training sessions for this reason.

But When you mention Rahul’s programming skill gap to him, his reaction baffles you: “What are you talking about? I am exceptionally skilled at programming. I don’t need training. In fact, I am one of the best programmers in your company.


Here, not only Rahul is unable to recognize his weakness, but he overestimates his skill in comparison to others. His lack of knowledge on the subject makes him unable to see his own errors.

Journey of an Entrepreneur

The Physicists Formula:

Albert-Laszlo Barabasi’s formula for success is as follows:

S=QR

Where S is success,

Q is a person’s ability to execute and

R is the potential value of a random idea.


What does this mean for strivers?

  • The math proves that the more ideas you have, the more times you plug the value of R. So greater will be the chances of success.

  • You can be successful at any age. All that matters is that you continue producing the same quantities of ideas.

  • The Q-factor in the above equation will remain unchanged.


Self-awareness before confidence:


  • Q-factor is for success. You either have it or you don’t.

  • There is an upside in accepting you are naturally lousy at some things and that, no matter how hard you try, you will never be good enough at that to generate massive success. Face that reality and avoid wasting your energy chasing a fruitless dream. Instead, you can pursue other opportunities you are better suitable for.

Strategic foresight:


  • By definition an entrepreneur’s job is to create change, whether it is just locally or internationally, an entrepreneur is trying to change the world in whatever way possible.

  • As an entrepreneur, your job is to bring the world to a future that only you can see.

  • Strategic foresight is about looking into the past for recurring trends that apply to the future. Taking in all the information available at present and actively implement strategies to shape and inform the world you want.

  • In other words, Strategic foresight is essentially the ability to make informed and educated guesses. However, it is more than just trying to predict the next market trend.

  • While it is impossible to predict the future, what you can do is learn how to employ tools like the strategic foresight.

Entrepreneur’s journey (My perception):

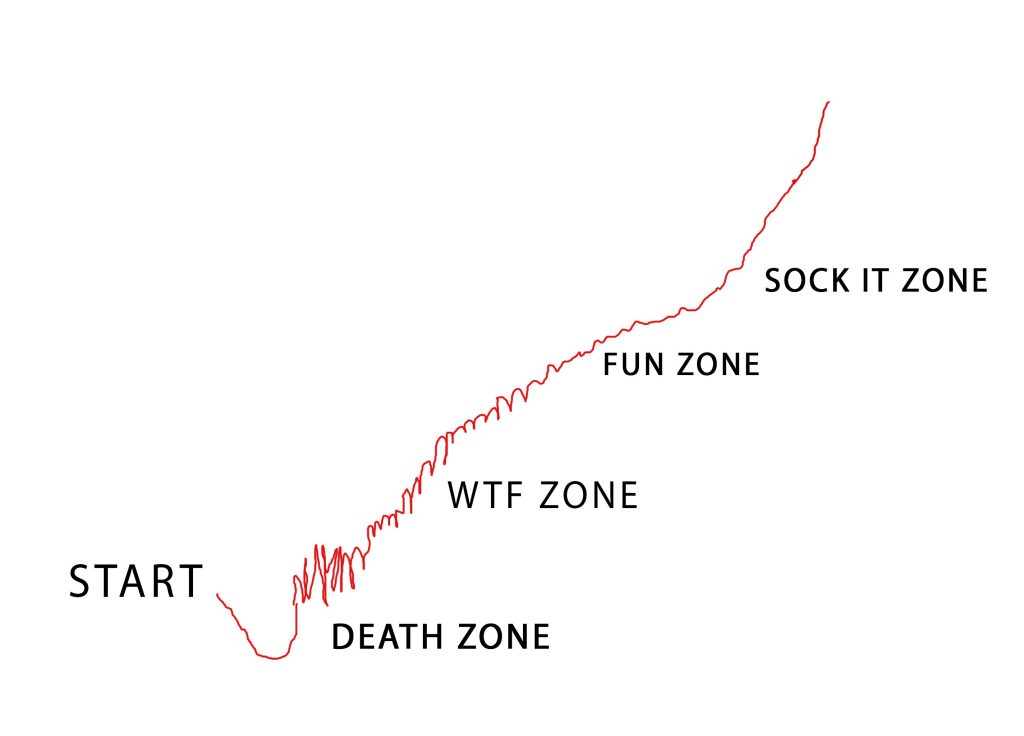
According to me, There will be 4 zones after being an Entrepreneur.

  1. Death Zone

  2. WTF Zone

  3. Fun Zone

  4. Sock it Zone


Let’s have look at the graph of this journey with respect to the above zones and try to understand it briefly.

Journey of an Entrepreneur

When we start our journey as an entrepreneur, we will fall in the death zone within a short time period. Startups never go on track initially or never goes as one expects. You will feel many times to quit in between starting to death zone. If you have patience and your startup has enough potential, you can reach WTF zone.

From the death zone to WTF zone, you won’t understand what is actually going on. You will get to know things which one can apply to change or modify for the betterment of the startup. You will come across lots of new ideas to modify your startup. If effective ideas are implemented properly, you will reach to fun zone.

Obviously, you will have fun here! Your startup will get stabilized here and you will have a good amount of profit too.

In the end, there is a sock it zone. Last three zones are very common. Every entrepreneur passes through it. To fall in the sock it zone, you require lots of experience and talent as it is the zone in which you will expand your startup to a higher level or you can say at the national or global level.

Journey of an Entrepreneur


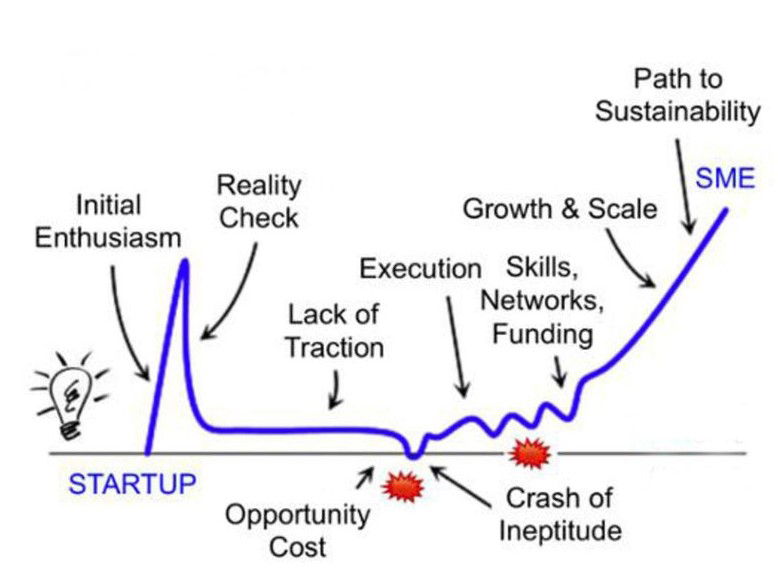
This graph explains the same thing in a different way. It is actually the same thing explaining in general perspective.  

EXAMPLES:

i will give two real-world examples.

1. We know in India, there is a problem of water supply in many rural areas. Women usually carry water over their head or shoulder and walk for some kilometers to bring it to their house.

Cynthia Koenig, an entrepreneur who studied at the University of Michigan found the solution to this problem as waterwheel.


This startup idea is simple, it is not costly, it is effective and easy to use.

Journey of an Entrepreneur

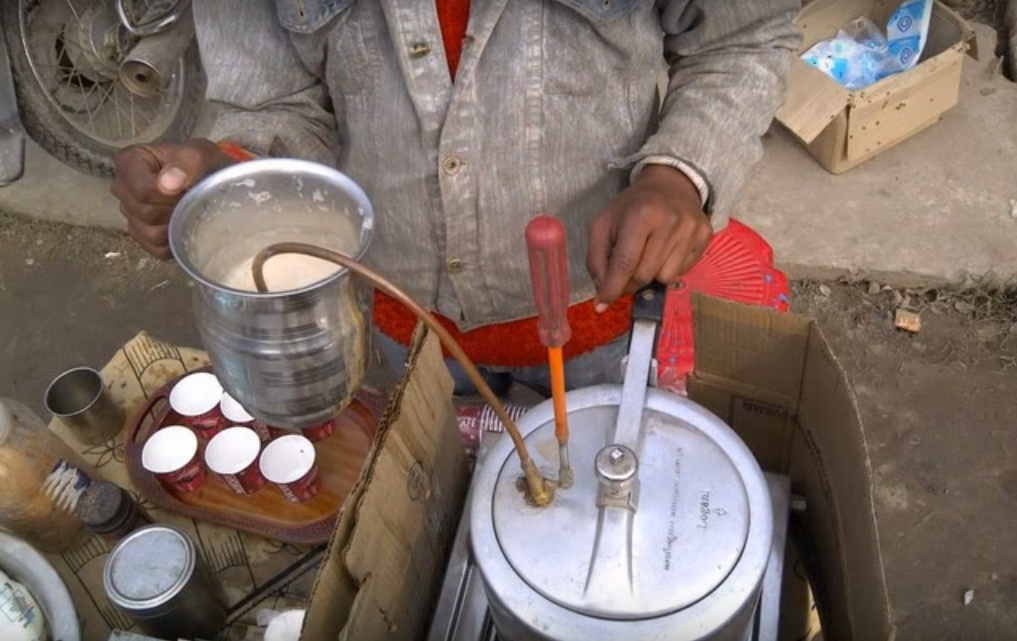
2. In India, tea and Coffee are the most popular drinks. There are many café and stores selling good coffee and tea. In most of the stores, you will find a latte machine for making a coffee. Poor people selling coffee or tea at the roadside, can not afford to buy a latte machine.


The guy shown in the picture below made an idea to make his own latte machine with some “JUGADS”. This too can be a very good startup idea as it is very cheap, effective and useful for the people who can’t afford costly latte machine.

Journey of an Entrepreneur

Conclusion:

At the end, we can say that Entrepreneurship and startup are the subjects that don’t have a well-defined syllabus. But have some few critical aspects/rule that you need to be creative, passionate and observing to get that one spark in your mind which can change the world for better.


Certainly, the field of startups is not at all a plain-sailing and also subject to great risks and failure but these are basic grooming cradles of large companies which later turn out to be a multinational. History has been the greatest proof so will be the future. So, if you have the courage to keep high stakes at your professional life, if you believe yourself more than anyone else can, and if you have the fire in you change the world for good than startup is best fit for you!    

Electrical Power Quality

Reading Time: 9 minutesWell, I feel very excited to discuss something very phenomenal.

If you think about the electrical power system you can easily imagine the whole system running in mind.

 The turbines rotated by some prime movers like steam or water. The generators produce electricity on the basis of a few great laws of Electromagnetism. Then, voltage is step up by transformers to compensate for heat loss in long transmission lines, then stepping down the voltage for distribution to the dear consumers. This is all most of us think to happen in this system. Simple and sweet.

Electrical Power Quality

But I want you to see a bigger, panoramic and a stunning picture of this modern marvel. I want you to get astounded by the problems and constraints they face and more importantly the principles and techniques they use to solve them. I have tried to keep the blog as general as possible because we, electrical engineers, don’t want to be not understood by society and also not want to be trivialized compared to other breeds!

The stage has been set and possibly now I would have been able to create a vacuum in your mind to suck the upcoming.

We will discuss:

  1. What are the typical technical problems that a power grid is subjected to, given the increasing modern electronic type of loads?
  2. Why the problems occur and how it affects in operation?
  3. How does the system is able to so robustly match such a wide variation of millions of consumers on the grid?
  4. What are the current approaches and the future perspectives of this billion dollars coin facet?

So let’s start by addressing a few very fundamental questions, not as simple as why we use electrical energy so widely.

Why we use AC or DC in particular cases?

AC and DC systems have their own advantages and disadvantages. The most satisfying ability of the AC system is to simply and efficiently step up and step down voltages to get low currents for minimal resistive heat dissipation in hundreds of km of long transmission lines. Whereas they are subject to more difficulties in maintaining constant phases, RMS values of power, voltage, and current.

DC system is very immune to fluctuations in currents, voltage, and phase angles unlike in AC. Most of the devices utilize DC like semiconductor devices, etc. But DC system requires sophisticated electronics for voltage step and step down.

Hence, national power grids have no option than to supply with high voltage AC power.

Why 3 phase AC power why not 1, 2, 4, or 5?

Will discuss the answer to this question in the next blog of this series, you can comment if you know.

So now it is clear that the transmission system uses 3 phase high voltage AC for transmission.


POWER QUALITY

Let’s dive deeper and consider more typical technical issues. And the good power quality is certainly the first deserving topic to be talked upon.

There are three aspects that mark good power quality:

  1. Steady RMS voltage level that stays well within the prescribed values.
  2. Steady frequency close to the rated value.
  3. A smooth voltage waveform resembling a sine/cosine wave.

It is surprising that the load itself is the factor that largely determines the quality of power. For the three factors, we will follow a simple “for loop”-

for(i=1; i<4; i++);

{

printf (“WHAT?“);

printf (“WHY?”);

printf (“EFFECTS”);

}

VOLTAGE FLUCTUATION: 


WHAT?

It is very important to keep the fluctuation of peak or RMS value of voltage within the range. The consumer end sees various types of variations:

a.) Swell: a considerable increase in RMS value (say 10-80%) for a considerable time period (say 30-60 sec).

b.) Dip: a considerable decrease in RMS value (say 10- 80%) for a considerable time period (say 30- 60 sec).

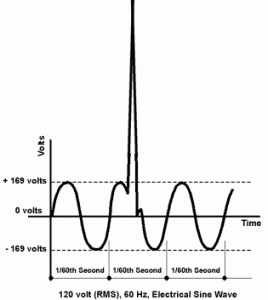
c.) Spikes: also called surges are a brief change in voltage for a small time period.

Electrical Power Quality

d.) Undervoltage: when the voltage drops significantly (~ 90%) for much extended time period (> 1 min). Also called brownout.

e.) Overvoltage: when the voltage increase significantly (~90%) for the time period > 1 min.

WHY?

a.) Undervoltage/dip:

We know that every load that we connect to the supply, it gets connected in parallel to the grid. And obviously, resistance in parallel always causes a lowered equivalent resistance. So every time we connect anything to supply the power station at the end sees a drop in the total resistance of grid and thus the current in circuit increases as voltage have to be maintained constant. If more and more people connect appliances to grid the equivalent resistance would go on decreasing and consequently due to high currents the system is declared overloaded.

So I hope you would have found an answer to why undervoltage occur in peak consumption time.

In case if not then here is the explanation:

  • The greater current causes a greater voltage drop in long transmission lines as well as the resistance of distribution transformers, and hence lesser voltage available at the user side.

b.) Overvoltage/swell:

In parallel circuits like that of the grid, overvoltage can only occur when the circuit is supplied by some other source itself. Yes, you are right, lightning is the major contributor.

Electrical Power Quality

  • Lightning: Obviously the voltage of strikes are far greater than what we use to play with. When it strikes it is like supplying the grid with an external source of millions of voltage (~5-20 million V). So, we see potentially hazardous overvoltage occur during cyclones, etc.
  • Electrostatically induced: Sometimes in overhead transmission lines, voltages get induced due to movement of large charged clouds passing by them.
  • Pollution: When various pollutants particles rub along the transmission line due to the force of wind the lines get charged and we see overvoltages.
  • Other types of effect are also there which require much mathematical analysis to understand like Ferranti effect which occurs when the grid is at minimal or no load.

EFFECTS

a.) Both of faults under/over voltage causes the machine to run inefficiently. Other effects include noisy operation, insulation breakdown, and lead to severe damage and lowered a lifetime of various machines.

b.) Flickering: random and frequent spikes in voltage causes a visible flickering in lighting equipment. Also, the devices that require constant power like T.V sets, telecommunication equipment, and other industrial processes are adversely affected by these voltage fluctuations.


FREQUENCY VARIATION:


WHAT?

In all power generation units, the generator used for generation is AC synchronous type. They are rotated by some prime mover (water/steam) at given synchronous speed to produce the voltage of a specified frequency. There are numerous factors that disturb the frequency to remain constant.

Frequency is a major factor in determining the performance of many AC devices. The system is required to maintain frequency in a range of -+2.5% of specified frequency (50 Hz in India).

WHY?

There are several reasons for the frequency variation.

As we saw that load applied in parallel to the grid reduces effective resistance, hence an increase in current. The increased current in the secondary side of distribution transformers is responded by an increased in primary as well.  Well, in the same manner, the effect reaches the alternators in the power station, where the current in stator increases which in turn exerts a greater force on the rotor to slow it down. Remember the frequency is greatly dependent on the RPM of rotors. The water or steam is adjusted accordingly to keep up the rotor speed.

The thermal power stations are slow at the response, whereas nuclear and hydroelectric power plants have a more rapid response to the load variations.

a.)  Suppose we lose a large load suddenly, the rotor speed would respond by an increase in rotational speed, frequency of voltage at the alternator terminals increases until the prime mover is adjusted by delivering less mechanical power.

b.) In case of a sudden large rise in load on the grid, the rotor of alternator would immediately slow down due to high current, hence it generates voltage of lower frequencies. The prime mover is in this case adjusted by increasing mechanical power availability.

EFFECT:

a.) It affects the stability of the overall system.

b.) In these days all the regional grids are connected to each other, hence all alternators need to run close to specified frequency for efficient power distribution.

c.) Device performance is reduced.

Frequency variation and waveform distortion are closely related to each other, let’s see how.

WAVEFORM DISTORTION:


WHAT?

Waveforms of two parameters are considered:

a.) Current Waveform distortion: a current waveform in a load is said to be distorted if it doesn’t resemble a pure sine wave. And sadly there are a whole lot of devices in the modern world in which load a no sense resemble a sine/cosine wave.

b.) Voltage Waveform distortion: in cases when the distorted current waveform is comparatively large, it makes the voltage waveforms across the load also different from a pure sine wave.

When all the distorted waves are taken into account the resultant waveform of current and voltage at the distribution transformer or at the power station is highly distorted from a sine wave.

WHY?

When we carry out a mathematical analysis of waveform distortion using Fourier analysis we get to know that the distorted waveform in load is resultant of numerous pure sine waveforms of different frequencies which are multiples of fundamental source frequency (50 Hz). We call them HARMONICS. Among all the harmonics the third harmonic is of greatest concern.


Electrical Power Quality

  • Typical electronics devices, which in general are called non-linear loads (resistance doesn’t remain constant for varying voltages and currents) are the biggest factors that contribute to waveform distortions. They include rectifiers, battery chargers, computers, electric motors, tube lights, LEDs, nearly every device we use today uses a distorted current waveform.
  • Voltage waveform distortion, however, is significant only when the current drawn by a load is greater. The distorted current causes distorted voltage waveform across the voltage source impedance, hence result in a distorted voltage across the load.
  • Voltage distortions are sometimes caused by alternator itself due to imperfect windings, but they are negligible.

EFFECT:

The distortion is a major growing concern these days due to increasing heavy non-linear loads.

a.) Regular operational difficulties like humming, heating, low efficiency, torque pulsation in motors are caused due to waveform distortion.

b.) More severe effects include a very low power factor due to current distortion. So, let’s first understand the POWER FACTOR!


WHAT EXACTLY IS POWER FACTOR?

Any force does maximum work in a given time when its direction is along the velocity, consider an electron, it will experience a force in the electric field, now due to any reason if this field is not along its velocity than a factor of cos (theta) will arise where theta is an angle between velocity and field lines.

In the case of AC both electric field and current oscillate, so if they are not in synchronization than only a component of force (voltage) will do useful work. For example, consider a swing system. Your pushing and pulling are in sync with the swing motion, if this is not then you can not deliver efficiently.

This is what gives rise to power factor that considers what is technically called phase relationship between voltage and current.

If the power factor is small then you need more current to supply the same power to your device.

Coming back to the point current distortion causes low power factor hence more current requirement, which has two disadvantages:

  1. Power companies charge you for the apparent power consumed by you, not the actual power. It is to compensate for the power dissipated by the current in the transmission line. Low power factor thus is cost ineffective to consumers.
  2. It also causes overloading of the grid as current is large, although actual power consumed is lower.


Now we are aware of problems quite well and its time to tackle them smartly.

The length of the blog will become considerably large and it will also lose its readability. Hence, the impact and the solutions would be discussed in part 2 of the blog.

Stay tuned!

TEAM CEV!


CEV - Handout